Understanding Independent and Dependent Variables in Algebra
Learn about independent and dependent variables in algebraic situations, equations, tables, and graphs. Discover the role of each variable, how they are classified, and their impact on functions. Practice identifying independent and dependent variables through examples and understand their significance in mathematical contexts.
Download Presentation

Please find below an Image/Link to download the presentation.
The content on the website is provided AS IS for your information and personal use only. It may not be sold, licensed, or shared on other websites without obtaining consent from the author. Download presentation by click this link. If you encounter any issues during the download, it is possible that the publisher has removed the file from their server.
E N D
Presentation Transcript
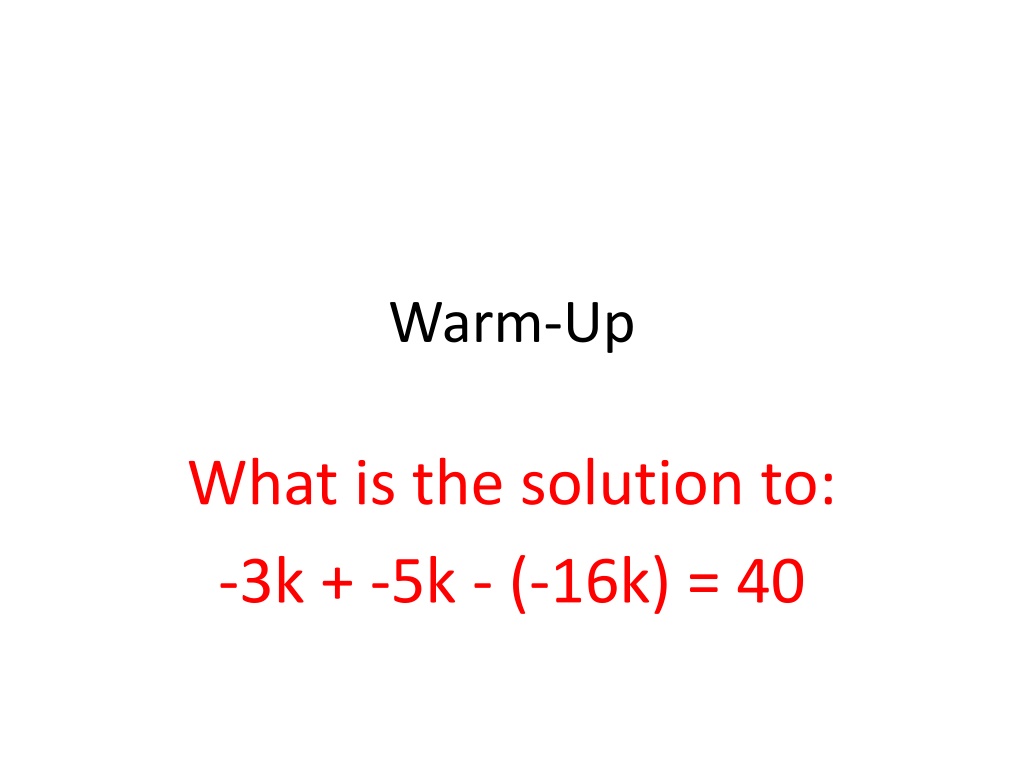
Warm-Up What is the solution to: -3k + -5k - (-16k) = 40
Finished with Test? Independent and Dependent Variables Make sure you have finished the Clue game if you want extra credit and showed all work. Get the worksheet on the front desk. Do the worksheet labeled Independent and Dependent Variables first. Review the worksheet you got yesterday with the vocab words on it. Add to your Brain Dump. We will see who has the most today. Work with a partner to match the variables once everyone has finished the test. Homework: Complete worksheet if not finished in class. Write this in your bull book. Extra Credit Project: Will be due next Friday, you will need to pick one scenario with independent and dependent variable and draw a picture of it. More details to come.
In an Algebraic situation, equation, table, or graph, the variables (usually x and y) can be classified as either __________ or _________. independent dependent
Independent Variable The independent variable is always located on the _________ of a graph. x-axis Input (domain) The independent variable is the ________________. It is usually the ________ in a table or equation. x The independent variable STANDS ALONE (___________). Does not depend The independent variable is what happens _______. FIRST
The variable in a function whose value is subject to choice is the independent variable. The independent variable affects the value of the dependent variable.
Dependent Variable The dependent variable is always located on the _________ of a graph. y-axis The dependent variable is the ______________. Output (Range) y It is usually the _______ in a table or equation. The dependent variable DEPENDS on the ________________. independent variable 2nd The dependent variable is what happens _______.
The variable in a function whose value is determined by the independent variable.
Lets Practice! 1. A student s grade depends on how much she studies. Independent variable:__________ Dependent variable:___________ 2. The height of a plant and the amount you water it. Independent variable: ___________ Dependent variable: _____________ Time studying grade Amount watered height
3. The amount of money you make and the number of hours you work. Independent variable: _____________ Dependent variable:_____________ 4. The number of sodas you buy and the total money spent. Independent variable:______________ Dependent variable:_______________ 5. The number of houses you can paint depends on how much time you have. Independent variable:______________ Dependent variable:_______________ Number of houses Hours worked Amount of money Number of sodas Total money Amount of time
Setting the PowerPoint View Use Normal View for the Interactive Elements To use the interactive elements in this presentation, do not select the Slide Show view. Instead, select Normal view and follow these steps to set the view as large as possible: On the View menu, select Normal. Close the Slides tab on the left. In the upper right corner next to the Help button, click the ^ to minimize the ribbon at the top of the screen. On the View menu, confirm that Ruler is deselected. On the View tab, click Fit to Window. Use Slide Show View to Administer Assessment Items To administer the numbered assessment items in this presentation, use the Slide Show view. (See Slide 7 for an example.)
Table of Contents Click on a topic to go to that section. Translating to Equations Translating to Equations Dependent and Independent Variables Dependent and Independent Variables Equations and Tables Equations and Tables Graphing Equations Graphing Equations
Translating to Equations Return to Table of Contents Return to Table of Contents
An equation is a statement that shows that two mathematical expressions are equal. These are examples of equations: 12 + a = 15 x/ 5= 10 y = 3x
1 The Dolphins scored 9 more points than the Jets. The Jets scored 34 points. Which equation could be used to find the number of points p that the Jets scored? A B C D p + 9 = 34 p + 34 = 9 p - 9 = 34 p - 34 = 9
2 Frank earns $8.50 per hour for mowing his neighbors' yards. Last weekend Frank earned $51. Which equation can be used to determine the number of hours h Frank worked last weekend? A 8.5h = 51 B 51h = 8.5 C 8.5/h = 51 D h/51 = 8.5
3 Melinda and her friends went to the theater and purchased 3 adult tickets and one large popcorn. One adult ticket costs $9, and they spent $33.75 at the theater. Which equation could be used to determine the cost c of the popcorn? A B C D 9c - 3 = 33.75 33.75-9 = c 3c + 9 = 33.75 3(9) + c = 33.75
Dependent and Independent Variables Return to Table of Contents Return to Table of Contents
Vocabulary An independent variable is one that is not influenced by another variable. The value of a dependent variable relies on the values of the independent variable.
Example Frank earns $8 per hour mowing his neighbors' lawns. The amount of money he earns m, depends on how many hours he works h. The more hours he works, the more money he earns. Therefore the dependent variable is money m, and the independent variable is hours h. The amount of hours he works does not rely on the money he earns.
Try to guess the missing variable. Independent Dependent how far you drive how much gas you use weight of child amount of dosage your test score how you study for the test With your group, try to think of at least three examples of independent and dependent variables? Click Independent Dependent
4 The number of tickets I can buy depends on how much money I have. A B True False
Click for Question The number of tickets I can buy depends on how much money I have. 5 So which value is the independent variable? A B amount of money number of tickets
6 It costs $4.25 to rent a movie. The amount of money I spend depends on how many movies I rent. So the dependent variable is the number of movies I rent. A B True False
7 The older I get, the taller I am. My height is the... A Independent Variable B Dependent Variable
8 The more people I have at my party, the more brownies I need to bake. The number of people at my party is the... A B Independent Variable Dependent Variable
Equations and Tables Equations and Tables Return to Table of Contents Return to Table of Contents
The relationship between dependent and independent variables can be represented with a table. Independent Input Dependent Output The independent variable is always in the left column, and the dependent variable is always in the right column. The relationship between independent & dependent variables and input & output works like a machine.
The value of the output relies on 1. The value of the input 2. The rule Rule The rule is the relationship between the input and the output. It says what happens to the input inside the machine. The value of the output always depends on the value of the input.
Let's Practice figuring out the rule. Step 1. Assign a value to the input. The input and output values will show on this table. Step 2. Hit Enter to see the output. Step 3. Once you have enough input/output values to figure out the rule, select + or * and the addend or factor. Click here for online practice. Click here for online practice. Step 4. Check Your Rule
The value of n is the input. Given the value for n, find the output using the given rule. Input Output n 2n 20 40 click 40 80 click 100 200 click
The manager of the department store raised the price $15 on each video game. Original price Price after mark up click $115 $100 click $70 $55 click $53 $38 click x + 15 x Can you find an expression (rule) that will satisfy the total cost of the video game if given the original price?
A parent wants to figure out the differences in grade level of her two sons. The younger son is two years behind the older one in terms of grade level. older son's grade level younger son's grade level 6 click 4th grade 10 8th grade click 2 click Kindergarten g click g - 2 Write an expression (rule) containing a variable which satisfies the difference in grade level of the two boys.
Tables can be used to represent equations. The table below represents the equation y = x + 3. x y 3 6 4 7 6 9 The output (y) depends on the input (x). So x is the independent variable, on the left, and y is the dependent variable, on the right.
This table represents the equation t = n + 11 Find the values for t, given the values for n. n t 21 10 click 39 28 click 51 40 click
This table represents the equation y = x - 60 Find the values for y, given the values for n. y x 80 20 click 120 60 click 180 120 click
This table represents the equation Find the values for t, given the values for n. t n 20 40 80
This table represents the equation y = 2x Find the values for y, given the values for x. x y 20 40 click 40 80 click 100 200 click
Equations and tables can also be used to represent real-life information mathematically. Natalie is going ice skating. The skating rink charges $6.25 per hour of skating. We will let h represent the number of hours of skating and c represent the total cost. Equation: c = 6.25 h hours (h) cost (c) 1 $6.25 2 $12.50 3 $18.75
Mary's age is twice the age of Jack. Can you think of an algebraic equation which determines Mary's age (m), given Jack's age (j)? Jack's Age Mary's Age 24 12 click 28 14 click 48 24 click a 2a click
The manager of the department store raised the price $15 on each video game. Can you find an equation that will satisfy the total cost of the video game (t) if given the original price (p)? Original price (p) Price after mark up (t) $115 $100 click $70 $55 click $53 $38 click x + 15 x click
9 Henry downloads songs into iTunes. The amount of time it takes him to download a song depends on the song's file size. Which is the independent variable? A B Download time File size
10 If it takes 50 seconds to download one megabyte, which equation represents this scenario ? Use the variable t for download time and s for file size. A s = 50t B t = 50s C 50 - s = t
11 Which table represents the equation t = 50s ? A B s t s t 200 4 4 200 100 2 5 250 50 1 6 300 D C s t s t 1 51 200 150 2 52 100 50 3 53 50 1
12 Find the missing value in this table. It takes Jonathan 6 minutes to run a mile. Let t represent the number of minutes and d represent the number of miles. (t) 6 18 (d) 1 ?
13 Use the equation y = 5x to complete the table. x y ? 20 ? 150 ? 50 A B C D ?=4 ?=30 ?=4 ?=30 ?= 10 ?= 100 ?=30 ?= 250 ?=100 ?=3 ?= 10 ?= 250
Graphing Equations Graphing Equations Return to Table of Contents Return to Table of Contents
You have learned that equations and tables are two ways to represent real-life scenarios. Equations and tables can also be graphed to represent a real-life scenario. Example: (x) (y) 1 50 A cafeteria has an automatic waffle-making machine. The table shows the relationship between the time in hours (x) and the number of waffles the machine can make (y). 2 100 3 150 4 200 5 250
(x) (y) The equation for this scenario is y = 50x 1 50 2 100 Each hour, 50 waffles are made. 3 150 4 200 The value of y depends on the value of x. 5 250 y is dependent x is independent This scenario can be represented with a graph. click When graphing: The independent variable is always across the xaxis. Thedependent variable is always up the y axis.
Once you have represented the equation in a function table, you can utilize the independent and dependent variable values as coordinates. Plot the coordinates from the table below to graph the scenario. Time (x) Waffles Made (y) 50 1 2 100 3 150 4 200 5 250
A bookstore is running a special and is charging $5 for any childrens' book. 1. Write an equation to represent the scenario. 2. Complete the table to represent the scenario. 3. Graph the function. # of Books (x) Total Cost (y) 1
