Survey Results on Tea Preferences Among 20 People
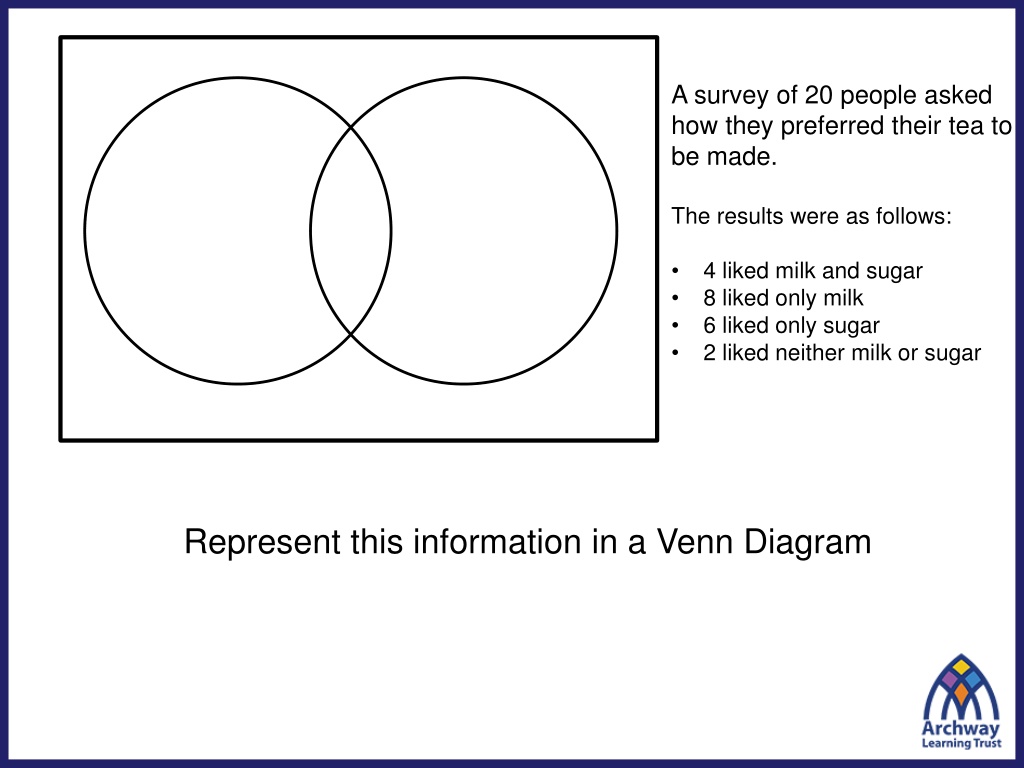
A survey of 20 people revealed that 4 liked milk and sugar in their tea, 8 preferred only milk, 6 favored only sugar, and 2 liked neither milk nor sugar. The information is represented in a Venn diagram. Additionally, the probability of a randomly chosen person preferring milk is 12/20. The probability of a randomly chosen person preferring sugar or milk, or both, is 18/20.

Download Presentation

Please find below an Image/Link to download the presentation.
The content on the website is provided AS IS for your information and personal use only. It may not be sold, licensed, or shared on other websites without obtaining consent from the author. Download presentation by click this link. If you encounter any issues during the download, it is possible that the publisher has removed the file from their server.
E N D
Presentation Transcript
A survey of 20 people asked how they preferred their tea to be made. The results were as follows: 4 liked milk and sugar 8 liked only milk 6 liked only sugar 2 liked neither milk or sugar Represent this information in a Venn Diagram
A survey of 20 people asked how they preferred their tea to be made. ? ? The results were as follows: 8 4 6 4 liked milk and sugar 8 liked only milk 6 liked only sugar 2 liked neither milk or sugar 2 One of the 20 people was asked at random how they preferred their tea. What is the probability that the chosen person preferred milk? ? ? =12 20
A survey of 20 people asked how they preferred their tea to be made. ? ? The results were as follows: 8 4 6 4 liked milk and sugar 8 liked only milk 6 liked only sugar 2 liked neither milk or sugar 2 One of the 20 people was asked at random how they preferred their tea. What is the probability that the chosen person preferred milk? ? ? =12 20
A survey of 20 people asked how they preferred their tea to be made. The results were as follows: 4 liked milk and sugar 8 liked only milk 6 liked only sugar 2 liked neither milk or sugar One of the 20 people was asked at random how they preferred their tea. What is the probability that the chosen person preferred sugar and milk? 4 ? ? ? = 20
A survey of 20 people asked how they preferred their tea to be made. The results were as follows: 4 liked milk and sugar 8 liked only milk 6 liked only sugar 2 liked neither milk or sugar One of the 20 people was asked at random how they preferred their tea. What is the probability that the chosen person preferred sugar and milk? 4 ? ? ? = 20
A survey of 20 people asked how they preferred their tea to be made. ? ? The results were as follows: 8 4 6 4 liked milk and sugar 8 liked only milk 6 liked only sugar 2 liked neither milk or sugar 2 One of the 20 people was asked at random how they preferred their tea. What is the probability that the chosen person preferred sugar or milk or both? ?(? ?) =18 20
A survey of 20 people asked how they preferred their tea to be made. The results were as follows: 4 liked milk and sugar 8 liked only milk 6 liked only sugar 2 liked neither milk or sugar One of the 20 people was asked at random how they preferred their tea. What is the probability that the chosen person preferred sugar or milk or both? ?(? ?) =18 20
A survey of 20 people asked how they preferred their tea to be made. ? ? The results were as follows: 8 4 6 4 liked milk and sugar 8 liked only milk 6 liked only sugar 2 liked neither milk or sugar 2 One of the 20 people was asked at random how they preferred their tea. What is the probability that the chosen person preferred no sugar? ?(? ) =10 20
A survey of 20 people asked how they preferred their tea to be made. ? ? The results were as follows: 8 4 6 4 liked milk and sugar 8 liked only milk 6 liked only sugar 2 liked neither milk or sugar 2 One of the 20 people was asked at random how they preferred their tea. What is the probability that the chosen person preferred no sugar? ?(? ) =10 20
A survey of 20 people asked how they preferred their tea to be made. ? ? The results were as follows: 8 4 6 4 liked milk and sugar 8 liked only milk 6 liked only sugar 2 liked neither milk or sugar 2 One of the 20 people was asked at random how they preferred their tea. What is the probability that the chosen person preferred no milk or sugar? 2 ? ? ? = 20
A survey of 20 people asked how they preferred their tea to be made. ? ? The results were as follows: 8 4 6 4 liked milk and sugar 8 liked only milk 6 liked only sugar 2 liked neither milk or sugar 2 One of the 20 people was asked at random how they preferred their tea. What is the probability that the chosen person preferred no milk or sugar? 2 ? ? ? = 20
A survey of 20 people asked how they preferred their tea to be made. ? ? The results were as follows: 8 4 6 4 liked milk and sugar 8 liked only milk 6 liked only sugar 2 liked neither milk or sugar 2 One of the 20 people was asked at random how they preferred their tea. What is the probability that the chosen person preferred only milk? 8 ? ? ? = 20
A survey of 20 people asked how they preferred their tea to be made. ? ? The results were as follows: 8 4 6 4 liked milk and sugar 8 liked only milk 6 liked only sugar 2 liked neither milk or sugar 2 One of the 20 people was asked at random how they preferred their tea. What is the probability that the chosen person preferred only milk? 8 ? ? ? = 20
Shade the correct region ? ? ? (? ?) ? ? ? ? ? ? ? (? ?)
Check your work ? ? ? (? ?) ? ? ? ? ? ? ? (? ?)
Your Turn A group of 200 Year 10 students are asked if they own a dog or a cat. 32 own both a dog and a cat; 25 students only have a cat; 95 students own a dog. Produce a Venn diagram to represent this situation. Devise a set of 12 probability questions to ask a friend about the Venn diagram. Ensure you work out the answers (including the set notation) for the questions you have devised.
95 Probability of owning a dog = ? ? = 200 Mark your work 57 Probability of owning a cat = ? ? = 200 Probability of not owning a dog = ? ? =105 200 32 Probability of not owning a cat = ? ? = 200 63 Probability of owning only a dog = ? ? ? = 200 25 Probability of owning only a cat = ? ? ? = 200 32 Probability of owning a dog and a cat = ? ? ? = 200 Probability of not owning a dog and a cat = ? ? ? =168 200 Probability of owning a cat or dog or both = ? ? ? =120 200 80 Probability of not owning either a cat or a dog = ? ? ? = 200 Probability of owning a cat given that a dog is owned = ? ? ????? ? =32 95 Probability of owning a dog given that a cat is owned = ? ? ????? ? =32 57
A student reasons that the probability of a randomly selected student owning a cat or dog or both is 152 probability of a student owning a dog is 95 of a student owning a cat is 57 200because the 200 and the probability 200 and 95 57 200=152 200+ 200 Explain the mistake they have made. Can you think of a general formula for ?(? ?)?