Health Profile Report of San Diego Unified School District 2014 Survey Results
Survey results from the 2014 School Health Profiles Report of the San Diego Unified School District show the percentage of schools using self-assessment tools in various health areas, school improvement plans with health-related objectives, and health and safety data review in the improvement planning process.

Download Presentation

Please find below an Image/Link to download the presentation.
The content on the website is provided AS IS for your information and personal use only. It may not be sold, licensed, or shared on other websites without obtaining consent from the author. Download presentation by click this link. If you encounter any issues during the download, it is possible that the publisher has removed the file from their server.
E N D
Presentation Transcript
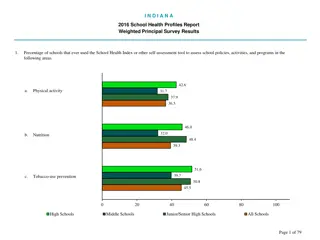
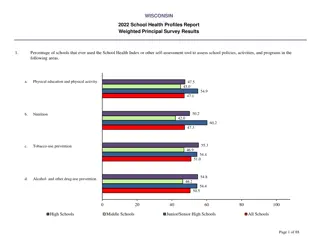
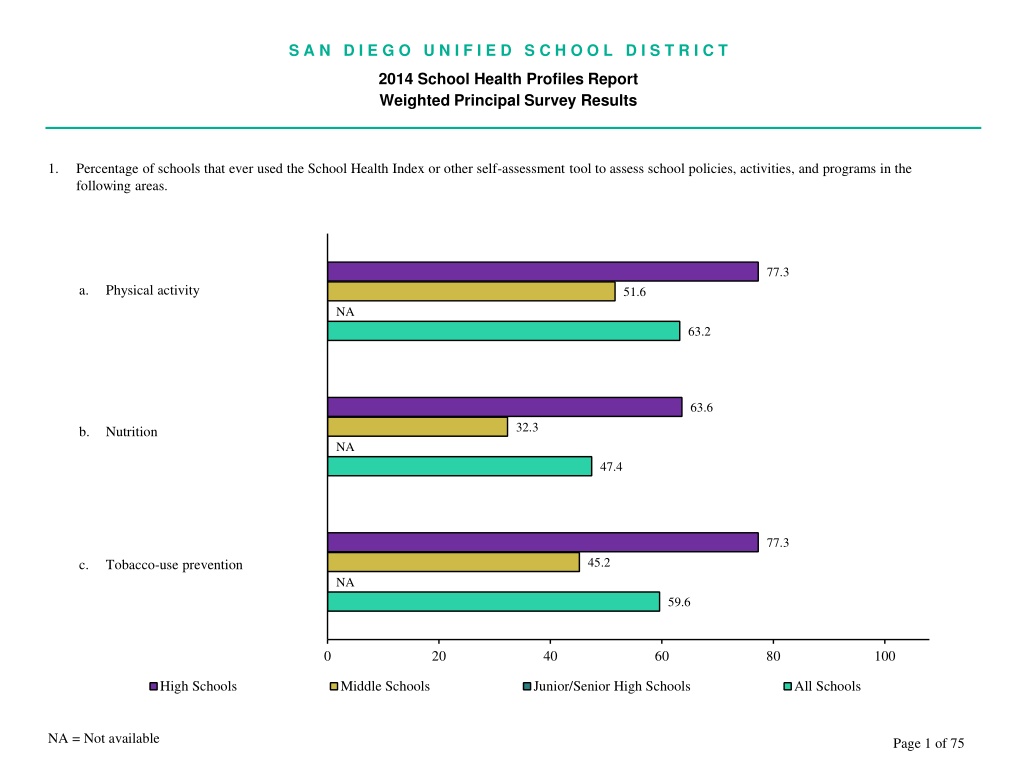
S A N D I E G O U N I F I E D S C H O O L D I S T R I C T 2014 School Health Profiles Report Weighted Principal Survey Results 1. Percentage of schools that ever used the School Health Index or other self-assessment tool to assess school policies, activities, and programs in the following areas. 77.3 a. Physical activity 51.6 NA 63.2 63.6 32.3 b. Nutrition NA 47.4 77.3 45.2 c. Tobacco-use prevention NA 59.6 0 20 40 60 80 100 High Schools Middle Schools Junior/Senior High Schools All Schools NA = Not available Page 1 of 75
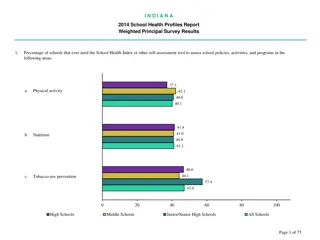
S A N D I E G O U N I F I E D S C H O O L D I S T R I C T 2014 School Health Profiles Report Weighted Principal Survey Results 1. Percentage of schools that ever used the School Health Index or other self-assessment tool to assess school policies, activities, and programs in the following areas. 47.6 d. Asthma 13.3 NA 27.3 72.7 35.5 e. Injury and violence prevention NA 50.9 71.4 29.0 f. HIV, STD, and teen pregnancy prevention NA 48.2 0 20 40 60 80 100 High Schools Middle Schools Junior/Senior High Schools All Schools NA = Not available Page 2 of 75
S A N D I E G O U N I F I E D S C H O O L D I S T R I C T 2014 School Health Profiles Report Weighted Principal Survey Results 2. Percentage of schools with a School Improvement Plan that includes health-related objectives on the following topics. 40.9 16.1 a. Health education NA 28.1 40.9 b. Physical education 16.1 NA 28.1 40.9 c. Physical activity 12.9 NA 26.3 33.3 d. School meal programs 16.1 NA 23.2 27.3 e. Foods and beverages available at school outside the school meal programs 3.3 NA 14.3 0 20 40 60 80 100 High Schools Middle Schools Junior/Senior High Schools All Schools NA = Not available Page 3 of 75
S A N D I E G O U N I F I E D S C H O O L D I S T R I C T 2014 School Health Profiles Report Weighted Principal Survey Results 2. Percentage of schools with a School Improvement Plan that includes health-related objectives on the following topics. 38.1 22.6 f. Health services NA 30.4 45.5 g. Mental health and social services 22.6 NA 33.3 54.5 h. Healthy and safe school environment 25.8 NA 38.6 54.5 i. Family and community involvement 33.3 NA 42.9 28.6 j. Faculty and staff health promotion 9.7 NA 17.9 0 20 40 60 80 100 High Schools Middle Schools Junior/Senior High Schools All Schools NA = Not available Page 4 of 75
S A N D I E G O U N I F I E D S C H O O L D I S T R I C T 2014 School Health Profiles Report Weighted Principal Survey Results 3. Percentage of schools that reviewed health and safety data as part of school's improvement planning process.* 100.0 79.3 NA 86.0 0 20 40 60 80 100 High Schools Middle Schools Junior/Senior High Schools All Schools *Among schools that engaged in an improvement planning process during the past year. NA = Not available Page 5 of 75
S A N D I E G O U N I F I E D S C H O O L D I S T R I C T 2014 School Health Profiles Report Weighted Principal Survey Results 4. Percentage of schools that currently have someone who oversees or coordinates school health and safety programs and activities. 90.9 81.3 NA 86.2 0 20 40 60 80 100 High Schools Middle Schools Junior/Senior High Schools All Schools NA = Not available Page 6 of 75
S A N D I E G O U N I F I E D S C H O O L D I S T R I C T 2014 School Health Profiles Report Weighted Principal Survey Results 5. Percentage of schools that have one or more than one group (e.g., a school health council, committee, or team) that offers guidance on the development of policies or coordinates activities on health topics. 66.7 48.5 NA 55.2 0 20 40 60 80 100 High Schools Middle Schools Junior/Senior High Schools All Schools NA = Not available Page 7 of 75
S A N D I E G O U N I F I E D S C H O O L D I S T R I C T 2014 School Health Profiles Report Weighted Principal Survey Results 6. Percentage of schools that have the following groups represented on any school health council, committee, or team.* 92.3 93.3 a. School administrators NA 93.3 58.3 b. Health education teachers 57.1 NA 57.1 84.6 c. Physical education teachers 85.7 NA 86.2 92.3 d. Other classroom teachers 71.4 NA 82.8 92.3 e. Mental health or social services staff (e.g., school counselors) 100.0 NA 96.7 0 20 40 60 80 100 High Schools Middle Schools Junior/Senior High Schools All Schools *Among schools that have one or more than one group that offers guidance on the development of policies or coordinates activities on health topics. NA = Not available Page 8 of 75
S A N D I E G O U N I F I E D S C H O O L D I S T R I C T 2014 School Health Profiles Report Weighted Principal Survey Results 6. Percentage of schools that have the following groups represented on any school health council, committee, or team.* 53.8 40.0 f. Nutrition or food service staff NA 46.7 92.3 g. Health services staff (e.g., school nurse) 100.0 NA 96.7 30.8 h. Maintenance and transportation staff 21.4 NA 27.6 30.8 i. Technology staff 14.3 NA 20.7 30.8 j. Library/media center staff 21.4 NA 24.1 0 20 40 60 80 100 High Schools Middle Schools Junior/Senior High Schools All Schools *Among schools that have one or more than one group that offers guidance on the development of policies or coordinates activities on health topics. NA = Not available Page 9 of 75
S A N D I E G O U N I F I E D S C H O O L D I S T R I C T 2014 School Health Profiles Report Weighted Principal Survey Results 6. Percentage of schools that have the following groups represented on any school health council, committee, or team.* 76.9 28.6 k. Student body NA 55.2 69.2 l. Parents or families of students 46.7 NA 60.0 69.2 m. Community members 33.3 NA 53.3 61.5 n. Local health departments, agencies, or organizations 28.6 NA 48.3 30.8 o. Faith-based organizations 7.1 NA 17.2 0 20 40 60 80 100 High Schools Middle Schools Junior/Senior High Schools All Schools *Among schools that have one or more than one group that offers guidance on the development of policies or coordinates activities on health topics. NA = Not available Page 10 of 75
S A N D I E G O U N I F I E D S C H O O L D I S T R I C T 2014 School Health Profiles Report Weighted Principal Survey Results 6. Percentage of schools that have the following groups represented on any school health council, committee, or team.* 23.1 p. Businesses 7.1 NA 17.2 38.5 7.1 q. Local government agencies NA 20.7 0 20 40 60 80 100 High Schools Middle Schools Junior/Senior High Schools All Schools *Among schools that have one or more than one group that offers guidance on the development of policies or coordinates activities on health topics. NA = Not available Page 11 of 75
S A N D I E G O U N I F I E D S C H O O L D I S T R I C T 2014 School Health Profiles Report Weighted Principal Survey Results 7. Percentage of schools that have a school health council, committee, or team that did the following activities during the past year.* 84.6 a. Identified student health needs based on a review of relevant data 86.7 NA 86.7 69.2 86.7 b. Recommended new or revised health and safety policies and activities to school administrators or the school improvement team NA 80.0 50.0 46.7 c. Sought funding or leveraged resources to support health and safety priorities for students and staff NA 48.3 0 20 40 60 80 100 High Schools Middle Schools Junior/Senior High Schools All Schools *Among schools that have one or more than one group that offers guidance on the development of policies or coordinates activities on health topics. NA = Not available Page 12 of 75
S A N D I E G O U N I F I E D S C H O O L D I S T R I C T 2014 School Health Profiles Report Weighted Principal Survey Results 7. Percentage of schools that have a school health council, committee, or team that did the following activities during the past year.* 92.3 d. Communicated the importance of health and safety policies and activities to district administrators, school administrators, parent-teacher groups, or community members 86.7 NA 90.0 76.9 71.4 e. Reviewed health-related curricula or instructional materials NA 75.9 100.0 86.7 f. Assessed the availability of physical activity opportunities for students NA 93.3 0 20 40 60 80 100 High Schools Middle Schools Junior/Senior High Schools All Schools *Among schools that have one or more than one group that offers guidance on the development of policies or coordinates activities on health topics. NA = Not available Page 13 of 75
S A N D I E G O U N I F I E D S C H O O L D I S T R I C T 2014 School Health Profiles Report Weighted Principal Survey Results 8. Percentage of schools that have any clubs that give students opportunities to learn about people different from them, such as students with disabilities, homeless youth, or people from different cultures. 100.0 75.8 NA 84.7 0 20 40 60 80 100 High Schools Middle Schools Junior/Senior High Schools All Schools NA = Not available Page 14 of 75
S A N D I E G O U N I F I E D S C H O O L D I S T R I C T 2014 School Health Profiles Report Weighted Principal Survey Results 9. Percentage of schools that offer each of the following activities for students to learn about people different from them, such as students with disabilities, homeless youth, or people from different cultures. 90.9 a. Lessons in class 93.8 NA 91.4 95.5 78.1 b. Special events sponsored by the school or community organizations (e.g., multicultural week, family night) NA 84.5 0 20 40 60 80 100 High Schools Middle Schools Junior/Senior High Schools All Schools NA = Not available Page 15 of 75
S A N D I E G O U N I F I E D S C H O O L D I S T R I C T 2014 School Health Profiles Report Weighted Principal Survey Results 10. Percentage of schools that have adopted a policy that addresses each of the following issues on HIV infection or AIDS. 95.2 a. Attendance of students with HIV infection 75.0 NA 80.7 95.2 81.3 b. Procedures to protect HIV-infected students and staff from discrimination NA 86.0 95.2 84.4 c. Maintaining confidentiality of HIV- infected students and staff NA 87.7 0 20 40 60 80 100 High Schools Middle Schools Junior/Senior High Schools All Schools NA = Not available Page 16 of 75
S A N D I E G O U N I F I E D S C H O O L D I S T R I C T 2014 School Health Profiles Report Weighted Principal Survey Results 11. Percentage of schools that have a student-led club that aims to create a safe, welcoming, and accepting school environment for all youth, regardless of sexual orientation or gender identity. 100.0 48.5 NA 69.5 0 20 40 60 80 100 High Schools Middle Schools Junior/Senior High Schools All Schools NA = Not available Page 17 of 75
S A N D I E G O U N I F I E D S C H O O L D I S T R I C T 2014 School Health Profiles Report Weighted Principal Survey Results 12. Percentage of schools that engage in the following practices related to lesbian, gay, bisexual, transgender, or questioning (LGBTQ) youth. Identify "safe spaces" (e.g., a counselor s office, designated classroom, or student organization) where LGBTQ youth can receive support from administrators, teachers, or other school staff Prohibit harassment based on a student's perceived or actual sexual orientation or gender identity a. 100.0 81.8 NA 88.1 100.0 b. 100.0 NA 100.0 c. Encourage staff to attend professional development on safe and supportive school environments for all students, regardless of sexual orientation or gender identity Facilitate access to providers not on school property who have experience in providing health services, including HIV/STD testing and counseling, to LGBTQ youth 95.5 87.9 NA 89.8 d. 86.4 72.7 NA 78.0 86.4 71.9 e. Facilitate access to providers not on school property who have experience in providing social and psychological services to LGBTQ youth NA 77.6 0 20 40 60 80 100 High Schools Middle Schools Junior/Senior High Schools All Schools NA = Not available Page 18 of 75
S A N D I E G O U N I F I E D S C H O O L D I S T R I C T 2014 School Health Profiles Report Weighted Principal Survey Results 13. Percentage of schools in which staff received professional development on preventing, identifying, and responding to student bullying and sexual harassment, including electronic aggression. 95.5 93.9 NA 93.2 0 20 40 60 80 100 High Schools Middle Schools Junior/Senior High Schools All Schools NA = Not available Page 19 of 75
S A N D I E G O U N I F I E D S C H O O L D I S T R I C T 2014 School Health Profiles Report Weighted Principal Survey Results 14. Percentage of schools that have a designated staff member to whom students can confidentially report student bullying and sexual harassment, including electronic aggression. 100.0 90.9 NA 91.5 0 20 40 60 80 100 High Schools Middle Schools Junior/Senior High Schools All Schools NA = Not available Page 20 of 75
S A N D I E G O U N I F I E D S C H O O L D I S T R I C T 2014 School Health Profiles Report Weighted Principal Survey Results 15. Percentage of schools that use electronic, paper, or oral communication to publicize and disseminate policies, rules, or regulations on bullying and sexual harassment, including electronic aggression. 100.0 97.0 NA 98.3 0 20 40 60 80 100 High Schools Middle Schools Junior/Senior High Schools All Schools NA = Not available Page 21 of 75
S A N D I E G O U N I F I E D S C H O O L D I S T R I C T 2014 School Health Profiles Report Weighted Principal Survey Results 16. Percentage of schools that taught a required physical education course in each of the following grades.* NA a. Sixth grade 100.0 NA 96.9 NA 100.0 b. Seventh grade NA 100.0 NA 100.0 c. Eighth grade NA 100.0 0 20 40 60 80 100 High Schools Middle Schools Junior/Senior High Schools All Schools *Among schools with students in that grade. NA = Not available Page 22 of 75
S A N D I E G O U N I F I E D S C H O O L D I S T R I C T 2014 School Health Profiles Report Weighted Principal Survey Results 16. Percentage of schools that taught a required physical education course in each of the following grades.* 100.0 d. Ninth grade NA NA 100.0 95.5 e. Tenth grade NA NA 96.2 71.4 NA f. Eleventh grade NA 76.0 71.4 NA g. Twelfth grade NA 76.0 0 20 40 60 80 100 High Schools Middle Schools Junior/Senior High Schools All Schools *Among schools with students in that grade. NA = Not available Page 23 of 75
S A N D I E G O U N I F I E D S C H O O L D I S T R I C T 2014 School Health Profiles Report Weighted Principal Survey Results 17. Percentage of schools in which physical education teachers or specialists received professional development on physical education or physical activity during the past year. 95.2 100.0 NA 96.5 0 20 40 60 80 100 High Schools Middle Schools Junior/Senior High Schools All Schools NA = Not available Page 24 of 75
S A N D I E G O U N I F I E D S C H O O L D I S T R I C T 2014 School Health Profiles Report Weighted Principal Survey Results 18. Percentage of schools that provide those who teach physical education with the following materials. 100.0 a. Goals, objectives, and expected outcomes for physical education 100.0 NA 98.3 81.8 93.8 b. A chart describing the annual scope and sequence of instruction for physical education NA 87.9 90.9 100.0 c. Plans for how to assess student performance in physical education NA 94.8 0 20 40 60 80 100 High Schools Middle Schools Junior/Senior High Schools All Schools NA = Not available Page 25 of 75
S A N D I E G O U N I F I E D S C H O O L D I S T R I C T 2014 School Health Profiles Report Weighted Principal Survey Results 18. Percentage of schools that provide those who teach physical education with the following materials. 77.3 d. A written physical education curriculum 90.6 NA 84.5 100.0 100.0 e. Resources for fitness testing NA 100.0 86.4 71.9 f. Physical activity monitoring devices, such as pedometers or heart rate monitors, for physical education NA 77.6 0 20 40 60 80 100 High Schools Middle Schools Junior/Senior High Schools All Schools NA = Not available Page 26 of 75
S A N D I E G O U N I F I E D S C H O O L D I S T R I C T 2014 School Health Profiles Report Weighted Principal Survey Results 19. Percentage of schools in which students participate in physical activity breaks in classrooms during the school day outside of physical education. 36.4 53.1 NA 44.8 0 20 40 60 80 100 High Schools Middle Schools Junior/Senior High Schools All Schools NA = Not available Page 27 of 75
S A N D I E G O U N I F I E D S C H O O L D I S T R I C T 2014 School Health Profiles Report Weighted Principal Survey Results 20. Percentage of schools that offer opportunities for all students to participate in intramural sports programs or physical activity clubs. 81.8 80.6 NA 80.7 0 20 40 60 80 100 High Schools Middle Schools Junior/Senior High Schools All Schools NA = Not available Page 28 of 75
S A N D I E G O U N I F I E D S C H O O L D I S T R I C T 2014 School Health Profiles Report Weighted Principal Survey Results 21. Percentage of schools that offer interscholastic sports to students. 100.0 31.3 NA 55.2 0 20 40 60 80 100 High Schools Middle Schools Junior/Senior High Schools All Schools NA = Not available Page 29 of 75
S A N D I E G O U N I F I E D S C H O O L D I S T R I C T 2014 School Health Profiles Report Weighted Principal Survey Results 22. Percentage of schools that offer opportunities for students to participate in physical activity before the school day through organized physical activities or access to facilities or equipment for physical activity. 63.6 48.4 NA 54.4 0 20 40 60 80 100 High Schools Middle Schools Junior/Senior High Schools All Schools NA = Not available Page 30 of 75
S A N D I E G O U N I F I E D S C H O O L D I S T R I C T 2014 School Health Profiles Report Weighted Principal Survey Results 23. Percentage of schools that prohibit staff from excluding students from physical education or physical activity to punish them for bad behavior or failure to complete class work in another class. 68.2 75.8 NA 69.5 0 20 40 60 80 100 High Schools Middle Schools Junior/Senior High Schools All Schools NA = Not available Page 31 of 75
S A N D I E G O U N I F I E D S C H O O L D I S T R I C T 2014 School Health Profiles Report Weighted Principal Survey Results 24. Percentage of schools that have a joint use agreement for shared use of school or community physical activity facilities. 77.3 63.6 NA 67.8 0 20 40 60 80 100 High Schools Middle Schools Junior/Senior High Schools All Schools NA = Not available Page 32 of 75
S A N D I E G O U N I F I E D S C H O O L D I S T R I C T 2014 School Health Profiles Report Weighted Principal Survey Results 25. Percentage of schools that have adopted a policy prohibiting tobacco use. 100.0 93.5 NA 96.5 0 20 40 60 80 100 High Schools Middle Schools Junior/Senior High Schools All Schools NA = Not available Page 33 of 75
S A N D I E G O U N I F I E D S C H O O L D I S T R I C T 2014 School Health Profiles Report Weighted Principal Survey Results 26. (Students) Percentage of schools that have a tobacco-use prevention policy that specifically prohibits the use of each type of tobacco for students during any school-related activity. 100.0 a. Cigarettes 93.5 NA 96.5 100.0 b. Smokeless tobacco (i.e., chewing tobacco, snuff, or dip) 93.5 NA 96.5 100.0 93.5 c. Cigars NA 96.5 100.0 93.5 d. Pipes NA 96.5 0 20 40 60 80 100 High Schools Middle Schools Junior/Senior High Schools All Schools NA = Not available Page 34 of 75
S A N D I E G O U N I F I E D S C H O O L D I S T R I C T 2014 School Health Profiles Report Weighted Principal Survey Results 26. (Faculty/Staff) Percentage of schools that have a tobacco-use prevention policy that specifically prohibits the use of each type of tobacco for faculty/staff during any school-related activity. 100.0 a. Cigarettes 93.3 NA 96.4 95.2 b. Smokeless tobacco (i.e., chewing tobacco, snuff, or dip) 93.3 NA 94.5 100.0 93.3 c. Cigars NA 96.4 100.0 93.3 d. Pipes NA 96.4 0 20 40 60 80 100 High Schools Middle Schools Junior/Senior High Schools All Schools NA = Not available Page 35 of 75
S A N D I E G O U N I F I E D S C H O O L D I S T R I C T 2014 School Health Profiles Report Weighted Principal Survey Results 26. (Visitors) Percentage of schools that have a tobacco-use prevention policy that specifically prohibits the use of each type of tobacco for visitors during any school-related activity. 100.0 a. Cigarettes 93.3 NA 96.4 95.2 b. Smokeless tobacco (i.e., chewing tobacco, snuff, or dip) 93.3 NA 94.5 100.0 93.3 c. Cigars NA 96.4 100.0 93.3 d. Pipes NA 96.4 0 20 40 60 80 100 High Schools Middle Schools Junior/Senior High Schools All Schools NA = Not available Page 36 of 75
S A N D I E G O U N I F I E D S C H O O L D I S T R I C T 2014 School Health Profiles Report Weighted Principal Survey Results 27. (Students) Percentage of schools that have a tobacco-use prevention policy that specifically prohibits tobacco use during each of the following times for students. 100.0 a. During school hours 93.5 NA 96.5 90.5 86.2 b. During non-school hours NA 88.9 0 20 40 60 80 100 High Schools Middle Schools Junior/Senior High Schools All Schools NA = Not available Page 37 of 75
S A N D I E G O U N I F I E D S C H O O L D I S T R I C T 2014 School Health Profiles Report Weighted Principal Survey Results 27. (Faculty/Staff) Percentage of schools that have a tobacco-use prevention policy that specifically prohibits tobacco use during each of the following times for faculty/staff. 100.0 a. During school hours 93.3 NA 96.4 90.0 65.5 b. During non-school hours NA 75.5 0 20 40 60 80 100 High Schools Middle Schools Junior/Senior High Schools All Schools NA = Not available Page 38 of 75
S A N D I E G O U N I F I E D S C H O O L D I S T R I C T 2014 School Health Profiles Report Weighted Principal Survey Results 27. (Visitors) Percentage of schools that have a tobacco-use prevention policy that specifically prohibits tobacco use during each of the following times for visitors. 100.0 a. During school hours 93.3 NA 96.4 85.7 65.5 b. During non-school hours NA 74.1 0 20 40 60 80 100 High Schools Middle Schools Junior/Senior High Schools All Schools NA = Not available Page 39 of 75
S A N D I E G O U N I F I E D S C H O O L D I S T R I C T 2014 School Health Profiles Report Weighted Principal Survey Results 28. (Students) Percentage of schools that have a tobacco-use prevention policy that specifically prohibits tobacco use in each of the following locations for students. 100.0 a. In school buildings 93.5 NA 96.5 100.0 b. Outside on school grounds, including parking lots and playing fields 93.5 NA 96.5 100.0 93.5 c. On school buses or other vehicles used to transport students NA 96.5 100.0 93.5 d. At off-campus, school-sponsored events NA 96.5 0 20 40 60 80 100 High Schools Middle Schools Junior/Senior High Schools All Schools NA = Not available Page 40 of 75
S A N D I E G O U N I F I E D S C H O O L D I S T R I C T 2014 School Health Profiles Report Weighted Principal Survey Results 28. (Faculty/Staff) Percentage of schools that have a tobacco-use prevention policy that specifically prohibits tobacco use in each of the following locations for faculty/staff. 100.0 a. In school buildings 93.5 NA 96.5 100.0 b. Outside on school grounds, including parking lots and playing fields 93.3 NA 96.4 100.0 93.3 c. On school buses or other vehicles used to transport students NA 96.4 100.0 93.3 d. At off-campus, school-sponsored events NA 96.4 0 20 40 60 80 100 High Schools Middle Schools Junior/Senior High Schools All Schools NA = Not available Page 41 of 75
S A N D I E G O U N I F I E D S C H O O L D I S T R I C T 2014 School Health Profiles Report Weighted Principal Survey Results 28. (Visitors) Percentage of schools that have a tobacco-use prevention policy that specifically prohibits tobacco use in each of the following locations for visitors. 100.0 a. In school buildings 93.5 NA 96.5 100.0 b. Outside on school grounds, including parking lots and playing fields 93.3 NA 96.4 100.0 93.3 c. On school buses or other vehicles used to transport students NA 96.4 100.0 90.0 d. At off-campus, school-sponsored events NA 94.6 0 20 40 60 80 100 High Schools Middle Schools Junior/Senior High Schools All Schools NA = Not available Page 42 of 75
S A N D I E G O U N I F I E D S C H O O L D I S T R I C T 2014 School Health Profiles Report Weighted Principal Survey Results 28N. Percentage of schools that follow a policy that mandates a "tobacco-free environment." A "tobacco-free environment" is one that prohibits tobacco use by students, staff, and visitors in school buildings, at school functions, in school vehicles, on school grounds, and at off-site school events, applicable 24 hours a day and seven days a week.* 80.0 65.5 NA 71.7 0 20 40 60 80 100 High Schools Middle Schools Junior/Senior High Schools All Schools *Responses to question 26 (a, b, c, and d), question 27 (a and b), and question 28 (a, b, c, and d) are all "yes." NA = Not available Page 43 of 75
S A N D I E G O U N I F I E D S C H O O L D I S T R I C T 2014 School Health Profiles Report Weighted Principal Survey Results 29. Percentage of schools that post signs marking a tobacco-free school zone, that is, a specified distance from school grounds where tobacco use is not allowed. 85.7 82.1 NA 84.9 0 20 40 60 80 100 High Schools Middle Schools Junior/Senior High Schools All Schools NA = Not available Page 44 of 75
S A N D I E G O U N I F I E D S C H O O L D I S T R I C T 2014 School Health Profiles Report Weighted Principal Survey Results 30. Percentage of schools that provide tobacco cessation services for each of the following groups. 13.6 a. Faculty and staff 16.1 NA 15.8 90.9 37.5 b. Students NA 58.6 0 20 40 60 80 100 High Schools Middle Schools Junior/Senior High Schools All Schools NA = Not available Page 45 of 75
S A N D I E G O U N I F I E D S C H O O L D I S T R I C T 2014 School Health Profiles Report Weighted Principal Survey Results 31. Percentage of schools that have arrangements with any organizations or health care professionals not on school property to provide tobacco cessation services for each of the following groups. 22.7 a. Faculty and staff 31.3 NA 29.3 72.7 46.9 b. Students NA 56.9 0 20 40 60 80 100 High Schools Middle Schools Junior/Senior High Schools All Schools NA = Not available Page 46 of 75
S A N D I E G O U N I F I E D S C H O O L D I S T R I C T 2014 School Health Profiles Report Weighted Principal Survey Results 32. Percentage of schools that never, rarely, sometimes, or always or almost always offer fruit or non-fried vegetables at school celebrations when foods or beverages are offered. 4.5 0.0 a. Foods or beverages are not offered at school celebrations NA 1.7 0.0 b. Never 3.0 NA 1.7 9.1 c. Rarely 9.1 NA 8.5 27.3 d. Sometimes 45.5 NA 37.3 59.1 e. Always or almost always 42.4 NA 50.8 0 20 40 60 80 100 High Schools Middle Schools Junior/Senior High Schools All Schools NA = Not available Page 47 of 75
S A N D I E G O U N I F I E D S C H O O L D I S T R I C T 2014 School Health Profiles Report Weighted Principal Survey Results 33. Percentage of schools in which students can purchase snack foods or beverages from one or more vending machines at the school or at a school store, canteen, or snack bar. 86.4 51.5 NA 66.1 0 20 40 60 80 100 High Schools Middle Schools Junior/Senior High Schools All Schools NA = Not available Page 48 of 75
S A N D I E G O U N I F I E D S C H O O L D I S T R I C T 2014 School Health Profiles Report Weighted Principal Survey Results 34. Percentage of schools in which students can purchase the following snack foods or beverages from vending machines or at the school store, canteen, or snack bar. 9.1 6.1 a. Chocolate candy NA 6.8 9.1 b. Other kinds of candy 9.1 NA 10.2 27.3 c. Salty snacks that are not low in fat (e.g., regular potato chips) 12.1 NA 16.9 63.6 d. Low sodium or no added salt pretzels, crackers, or chips 39.4 NA 50.0 19.0 e. Cookies, crackers, cakes, pastries, or other baked goods that are not low in fat 24.2 NA 22.4 0 20 40 60 80 100 High Schools Middle Schools Junior/Senior High Schools All Schools NA = Not available Page 49 of 75
S A N D I E G O U N I F I E D S C H O O L D I S T R I C T 2014 School Health Profiles Report Weighted Principal Survey Results 34. Percentage of schools in which students can purchase the following snack foods or beverages from vending machines or at the school store, canteen, or snack bar. 4.5 6.3 f. Ice cream or frozen yogurt that is not low in fat NA 5.2 36.4 g. 2% or whole milk (plain or flavored) 18.2 NA 23.7 42.9 h. Nonfat or 1% (low-fat) milk (plain) 27.3 NA 32.8 23.8 i. Water ices or frozen slushes that do not contain juice 12.1 NA 15.5 18.2 j. Soda pop or fruit drinks that are not 100% juice 6.1 NA 11.9 0 20 40 60 80 100 High Schools Middle Schools Junior/Senior High Schools All Schools NA = Not available Page 50 of 75