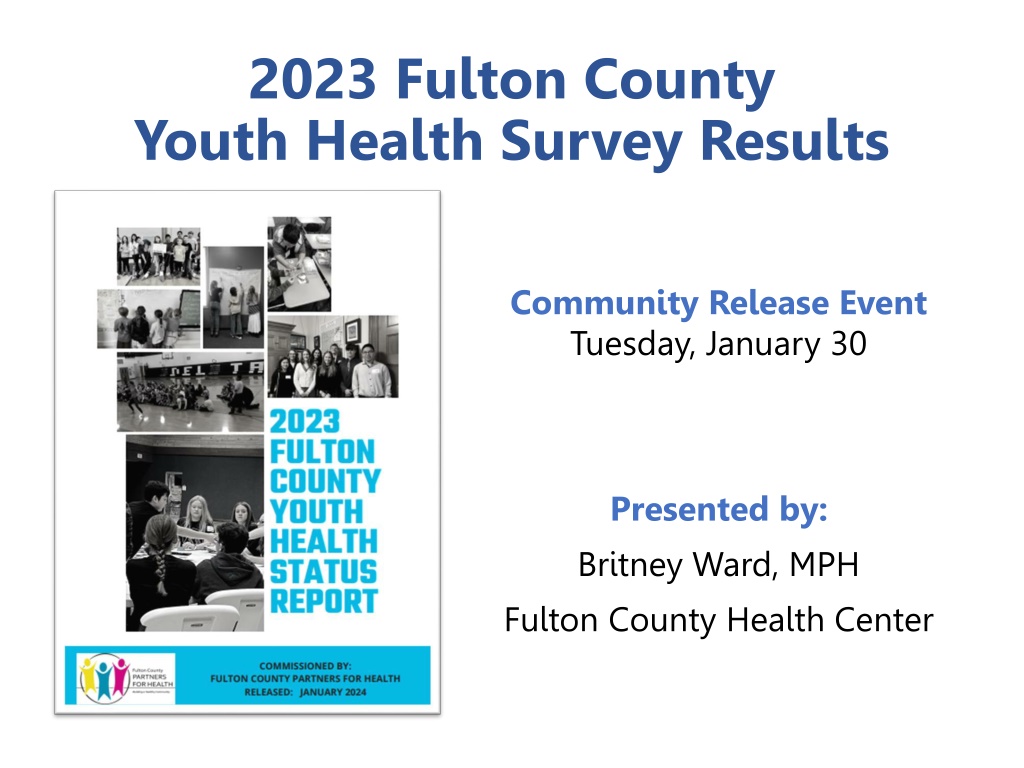
2023 Fulton County Youth Health Survey Results Community Release Event
The 2023 Fulton County Youth Health Survey Results will be presented at a community release event on Tuesday, January 30. The survey covers various aspects such as weight status, tobacco use, alcohol consumption, drug use, perceptions of substance use, sexual behavior, mental health, social determinants of health, and violence. Funded by multiple organizations and commissioned by various departments, the survey methodology involved an online survey with a high response rate. Data analysis was done using SPSS 28.0, with limitations on self-reported data. The event will be presented by Britney Ward, MPH, from the Fulton County Health Center.
Download Presentation

Please find below an Image/Link to download the presentation.
The content on the website is provided AS IS for your information and personal use only. It may not be sold, licensed, or shared on other websites without obtaining consent from the author. Download presentation by click this link. If you encounter any issues during the download, it is possible that the publisher has removed the file from their server.
E N D
Presentation Transcript
2023 Fulton County Youth Health Survey Results Community Release Event Tuesday, January 30 Presented by: Britney Ward, MPH Fulton County Health Center
Funders Fulton County Health Center Fulton County Health Department Fulton County Job & Family Services
Commissioned by: Archbold Police Department Delta Police Department Fayette Police Department Four County ADAMhs Board Fulton County Board of Developmental Disabilities Fulton County Commissioners Office Fulton County Economic Development Fulton County Family & Children First Council Fulton County Health Center Fulton County Health Department Fulton County Job & Family Services Fulton County Schools Fulton County Senior Center Fulton County Sheriff s Office Healthy Choices Caring Communities Maumee Valley Guidance Center North Star BlueScope Steel Northwestern Ohio Community Action Ohio State University Extension Recovery Services of Northwest Ohio Swanton Police Department United Way of Fulton County Wauseon Police Department
Acknowledgements Project Management, Secondary Data, and Report Development Hospital Council of Northwest Ohio Gabrielle MacKinnon, MPH, Community Health Improvement Manager Jodi Franks, MPH, CHES, Community Health Improvement Coordinator Emilee Tancak, Graduate Assistant Data Analysis Joseph A. Dake, Ph.D., MPH, Professor and Chair, School of Population Health, University of Toledo
Overview Weight Status Tobacco Use Alcohol Consumption Drug Use Perceptions of Substance Use Sexual Behavior Mental Health Social Determinants of Health Violence
Methodology Design Online survey Instrument Development Majority of questions from YRBSS Procedure Youth: schools & grades randomly selected, surveys administered in classrooms, passive permission slips Response Rates 91% (n=756: CI= + 3.21) Power analysis #: 350
Methodology Data Analysis Analyzed using SPSS 28.0 Limitations Self-reported data Caution should be used when interpreting subgroup results as the margin of error for any subgroup is higher than that of the overall survey. IRB Approval Advarra, Inc., Columbia, MD Review methodology, surveys, and letters
Demographics of Survey Population: Grade Level High School (9-12) 54% Middle School (6-8) 46% Note: Percentages may not add to 100% due to missing data (non-responses)
Demographics of Survey Population: Age 18 years old or older 5% 12 years old or younger 24% 17 years old 13% 16 years old 15% 13 years old 16% 15 years old 14% 14 years old 12% Note: Percentages may not add to 100% due to missing data (non-responses)
Demographics of Survey Population: Gender Other 1% Female 46% Male 53% Note: Percentages may not add to 100% due to missing data (non-responses)
Demographics of Survey Population: Race/Ethnicity Native Hawaiian or Other Pacific Islander 1% Asian 2% Biracial/Mixed, 5% Other 6% Black or African American 3% American Indian and Alaska Native 8% Hispanic or Latino 13% White 84% Note: Percentages may not add to 100% due to missing data (non-responses)
Weight Status 18% of Fulton County youth were classified as obese by BMI. 11% of youth were classified as overweight 69% were classified as normal weight 2% were classified as underweight 32% described themselves as being slightly or very overweight 53% described themselves as being about the right weight 15% described themselves as being slightly or very underweight
Weight Status Fulton County Youth BMI Classifications 2% 1% 2% 2% 2% 7% 3% 3% 3% 3% 4% 100% 80% 59% 66% 65% 65% 70% 69% 67% 69% 72% 71% 60% 67% 40% 14% 8% 13% 14% 14% 11% 12% 15% 9% 20% 12% 13% 23% 22% 19% 18% 18% 18% 17% 17% 14% 14% 13% 0% Total Male Female 13 or younger 14-16 17 & older Fulton 2012 Fulton 2014 Fulton 2016 Fulton 2018 Fulton 2021 Obese Overweight Normal Weight Underweight Note: Caution should be used when interpreting subgroup results as the margin of error for any subgroup is higher than that of the overall survey.
Weight Status 26% of youth ate 5 or more servings of fruits and/or vegetables per day 38% ate 3-4 servings per day 31% ate 1-2 servings per day 5% ate 0 servings of fruits and/or vegetables per day 0 1-2 3-4 5 or more servings servings servings servings Fruit Vegetables 10% 16% 66% 65% 18% 16% 6% 3% Fruit and/or vegetables 5% 31% 38% 26%
Weight Status 88% of youth drank 1 or more servings of sugar- sweetened beverages per day 61% of youth drank 1 or more servings of caffeinated beverages per day 0 1-2 3-4 5 or more servings servings servings servings Sugar-sweetened beverages 12% 67% 14% 7% Caffeinated beverages 39% 46% 10% 5%
Weight Status 78% of youth had participated in at least 60 minutes of physical activity on 3 or more days in the past week 67% of youth participated in at least 60 minutes of physical activity every day in the past week 11% of youth did not participate in at least 60 minutes of physical activity on any day in the past week On an average school night youth spent an average of: 3.0 hours using screens (e.g., video games, social media) 1.8 hours doing extracurricular activities (e.g., sports, scouts) 1.1 hours doing homework 1.0 hour working at a job
Weight Status High School State & National Comparisons Fulton County 2023 (9th-12th) 20% 19% 12% 13% 6th-12th Grade Fulton County Comparisons Fulton County 2012 (6th-12th) 14% 12% Fulton County 2014 (6th-12th) 13% 13% Fulton County 2016 (6th-12th) 18% 14% Fulton County 2018 (6th-12th) 19% 13% Fulton County 2021 (6th-12th) 18% 14% Fulton County 2023 (6th-12th) 18% 11% Ohio 2021 (9th-12th) U.S. 2021 (9th-12th) Youth Comparisons Obese Overweight Described themselves as slightly or very overweight Physically active at least 60 minutes per day on every day in past week Physically active at least 60 minutes per day on 5 or more days in past week Did not participate in at least 60 minutes of physical activity on any day in past week 16% 16% 30% 28% 32% 33% 30% 32% 31% N/A 32% 34% 37% 34% 32% 30% 37% 31% 26% 24% 62% 64% 61% 57% 58% 62% 60% 49% 45% 7% 8% 11% 15% 11% 11% 8% 16% 16% N/A Not Available
Tobacco Use 1% of Fulton County youth were current cigarette smokers 4% of youth were current electronic vapor product users The average age of onset for using some form of tobacco or vape product was 12.8 years old
Tobacco Use Fulton County Youth Current Cigarette Smokers 10% 8% 7% 6% 6% 5% 3% 2% 2% 1% 1% 1% 1% 0% Total Male Female 13 or younger 14-16 17 & older Fulton 2012 Fulton 2014 Fulton 2016 Fulton 2018 Fulton 2021 Note: Caution should be used when interpreting subgroup results as the margin of error for any subgroup is higher than that of the overall survey.
Tobacco Use Fulton County Youth Current Electronic Vapor Product Users 10% 8% 5% 4% 4% 3% 3% 2% 0% Total Male Female 13 or younger 14 to 16 17 & older Note: Caution should be used when interpreting subgroup results as the margin of error for any subgroup is higher than that of the overall survey.
Tobacco Use Behaviors of Fulton County Youth E-Cigarette/Vape Users* vs. Non-E-Cigarette/Vape Users Non- E-Cigarette/ Vape User Youth Behaviors E-Cigarette/ Vape User 92% Currently participate in extracurricular activities Felt so sad or hopeless almost every day for two weeks or more in a row that they stopped doing usual activities (in the past 12 months) Bullied (in the past 12 months) Seriously considered attempting suicide (in the past 12 months) Had sexual intercourse (in their lifetime) Experienced 3 or more adverse childhood experiences (ACEs) (in their lifetime) Attempted suicide (in the past 12 months) Used marijuana (in the past 30 days) Had at least one drink of alcohol (in the past 30 days) Smoked cigarettes (in the past 30 days) Used prescription medication not prescribed to them (in their lifetime) 93% 59% 24% 53% 37% 36% 32% 9% 6% 50% 19% 25% 22% 20% 12% 0% 3% 1% 2% 0% <1% *Indicates use in past year Note: Caution should be used when interpreting subgroup results as the margin of error for any subgroup is higher than that of the overall survey.
Tobacco Use Youth used the following forms of tobacco in the past year: Vape products (9%) Cigarettes (2%) Chewing tobacco, snuff, or dip (1%) Pouch (1%) Swishers (<1%) Bidis, cigars, Black & Milds, cigarillos, little cigars (<1%) Dissolvable tobacco products (<1%) Hookah (<1%) Other (<1%) Of youth who used e-cigarettes/vapes in the past year, they reported putting the following in them: Flavor with nicotine (85%) Flavor without nicotine (21%) Marijuana or THC (17%) No flavor with nicotine (6%) Homemade (2%)
Tobacco Use Youth tobacco users reported the following ways of obtaining tobacco products: Borrowed (or bummed) tobacco products from someone else (29%) Gave someone else money to buy them (26%) Took them from a family member (17%) A person 21 years or older gave them tobacco products (9%) Bought them from a store such as a gas station, convenience store, or supermarket (9%) A family member or friend 21 years or older gave them the tobacco products (6%) Purchased them online (6%) Some other way (31%)
Youth Tobacco Use High School State & National Comparisons Fulton County 2023 (9th-12th) 6th-12th Grade Fulton County Comparisons Fulton County 2012 (6th-12th) Fulton County 2014 (6th-12th) Fulton County 2016 (6th-12th) Fulton County 2018 (6th-12th) Fulton County 2021 (6th-12th) Fulton County 2023 (6th-12th) Ohio 2021 (9th-12th) U.S. 2021 (9th-12th) Youth Comparisons Current smoker (smoked cigarettes on at least 1 day during the past 30 days) Currently used an electronic vapor product (including e- cigarettes, e-cigars, e-pipes, vape pipes, vaping pens, e- hookahs, and hookah pens, on at least one day during the past 30 days) Used electronic vapor products daily (including e- cigarettes, e-cigars, e-pipes, vape pipes, vaping pens, e- hookahs, and hookah pens, on all 30 days during the past 30 days) 7% 8% 6% 6% 3% 1% 2% 3% 4% N/A N/A N/A N/A N/A 4% 5% 20% 18% N/A N/A N/A N/A N/A 1% 2% 6% 5% N/A Not Available
Alcohol Consumption 21% of Fulton County youth had at least one drink of alcohol in their life 3% had at least one drink in the past 30 days (current drinker) Of all youth, 7% drank alcohol for the first time before the age of 13 The average age of onset was 13.3 years old
Alcohol Consumption Fulton County Youth Who Were Current Drinkers 20% 15% 15% 11% 10% 10% 9% 7% 3% 3% 3% 2% 1% 0% Total Male Female 13 or younger 14-16 17 & older Fulton 2012 Fulton 2014 Fulton 2016 Fulton 2018 Fulton 2021 Note: Caution should be used when interpreting subgroup results as the margin of error for any subgroup is higher than that of the overall survey.
Alcohol Consumption Based on all youth, 2% were binge drinkers Of those who drank in the past month, 61% were identified as binge drinkers In the past month, 15% of youth rode in a car or other vehicle driven by someone who had been drinking alcohol
Alcohol Consumption Fulton County Youth Binge Drinking in Past Month 15% 10% 10% 9% 8% 6% 5% 5% 4% 2% 2% 2% 1% 1% 0% Total Male Female 13 or younger 14-16 17 & older Fulton 2012 Fulton 2014 Fulton 2016 Fulton 2018 Fulton 2021 Note: Caution should be used when interpreting subgroup results as the margin of error for any subgroup is higher than that of the overall survey.
Alcohol Consumption Behaviors of Fulton County Youth Current Drinkers vs. Non-Current Drinkers Non- Current Drinker 92% 7% Current Drinker Youth Behaviors Currently participate in extracurricular activities Had sexual intercourse (in their lifetime) Felt sad or hopeless almost every day for two weeks or more in a row that they stopped doing some usual activities (in the past 12 months) Experienced 3 or more adverse childhood experiences (ACEs) (in their lifetime) Bullied (in the past 12 months) Used marijuana (in the past 30 days) Seriously considered attempting suicide (in the past 12 months) Attempted suicide (in the past 12 months) Smoked cigarettes (in the past 30 days) Used prescription medication not prescribed to them (in their lifetime) 100% 63% 57% 26% 41% 36% 26% 22% 17% 13% 0% 22% 34% 2% 11% 5% 1% <1% Current drinkers indicate youth who self-reported having had at least one drink of alcohol during the past 30 days. Note: Caution should be used when interpreting subgroup results as the margin of error for any subgroup is higher than that of the overall survey.
Alcohol Consumption Youth drinkers reported they got their alcohol from the following in the past 30 days: Someone gave it to them (23%) Took it from a family member (23%) Friend or sibling 21 and older bought it for them (14%) Their parent gave it to them (14%) A friend s parent gave it to them (5%) Bought it in a liquor store, supermarket, discount store, or gas station (5%) Bought it with a fake ID (5%) Some other way (32%)
Alcohol Consumption High School State & National Comparisons Fulton County 2023 (9th-12th) 6th-12th Grade Fulton County Comparisons Fulton County 2021 (6th-12th) Fulton County 2023 (6th-12th) Fulton County 2012 (6th-12th) Fulton County 2014 (6th-12th) Fulton County 2016 (6th-12th) Fulton County 2018 (6th-12th) Ohio 2021 (9th-12th) U.S. 2021 (9th-12th) Youth Comparisons Ever drank alcohol (at least one drink of alcohol on at least 1 day during their life) Current drinker (at least one drink of alcohol on at least 1 day during the past 30 days) Binge drinker (females drank four or more drinks while males drank five or more drinks within a couple hours on at least one day during the past 30 days) Drank for the first time before age 13 (of all youth) 42% 42% 36% 43% 25% 21% 28% N/A N/A 15% 15% 9% 11% 7% 3% 5% 23% 23% 9% 10% 4% 8% 5% 2% 3% 13% 11% 15% 13% 12% 15% 7% 7% 4% 11% 15% N/A Not Available
Alcohol Consumption High School State & National Comparisons Fulton County 2023 (9th-12th) 6th-12th Grade Fulton County Comparisons Fulton County 2021 (6th-12th) Fulton County 2023 (6th-12th) Fulton County 2012 (6th-12th) Fulton County 2014 (6th-12th) Fulton County 2016 (6th-12th) Fulton County 2018 (6th-12th) Ohio 2021 (9th-12th) U.S. 2021 (9th-12th) Youth Comparisons Obtained the alcohol they drank by someone giving it to them (of current drinkers) Rode with a driver who had been drinking alcohol (in a car or other vehicle on one or more occasion during the past month) N/A N/A 38% 30% 33% 23% 26% N/A 40% N/A N/A N/A N/A 10% 15% 11% N/A 14% N/A Not Available
Drug Use 3% of all Fulton County youth had used marijuana, weed, or THC in the past 30 days Youth who used marijuana in the past 30 days reported using it in the following ways: Smoked it (60%) Vaporized it (45%) Ate it (32%) Dabbed it (23%) Drank it (5%) Used it some other way (23%)
Drug Use Fulton County Youth Current Marijuana Use 10% 7% 7% 7% 6% 6% 5% 4% 4% 4% 3% 2% 1% 0% Total Male Female 13 or younger 14-16 17 & older Fulton 2012 Fulton 2014 Fulton 2016 Fulton 2018 Fulton 2021 Note: Caution should be used when interpreting subgroup results as the margin of error for any subgroup is higher than that of the overall survey.
Drug Use Behaviors of Fulton County Youth Current Marijuana Use* vs. Non-Current Marijuana Use Current Marijuana User 91% Non-Current Marijuana User 92% Youth Behaviors Currently participate in extracurricular activities Felt sad or hopeless almost every day for two weeks or more in a row that they stopped doing some usual activities (in the past 12 months) Had sexual intercourse (in their lifetime) Experienced 3 or more adverse childhood experiences (ACEs) (in their lifetime) Bullied (in the past 12 months) Seriously considered attempting suicide (in the past 12 months) Have had at least one drink of alcohol (in the past 30 days) Attempted suicide (in the past 12 months) Smoked cigarettes (in the past 30 days) Used prescription medication not prescribed to them (in their lifetime) 59% 27% 55% 50% 46% 36% 29% 23% 14% 0% 7% 21% 34% 11% 2% 5% 1% <1% * Current marijuana use indicates youth who self-reported using marijuana at any time during the past 30 days. Note: Caution should be used when interpreting subgroup results as the margin of error for any subgroup is higher than that of the overall survey.
Drug Use Less than 1% of youth used prescription medication that was not prescribed to them in the past 30 days 4% of youth reported using medications that were not prescribed for them at least once in their lifetime
Drug Use Fulton County youth had tried the following in their life: Bath salts (2%) Liquid THC (1%) Inhalants (1%) Hallucinogenic drugs such as LSD, acid, PC, angel dust, mescaline, or mushrooms (1%) Cocaine, including powder, crack, or freebase (1%) Misused over-the-counter medications [to get high] (1%) Misused hand sanitizer (1%) Misused cough syrup (1%) Posh/salvia/synthetic marijuana (<1%) Steroid pills, creams, or shots without a doctor s prescription (<1%) Opioids (<1%) Methamphetamines (<1%) Ecstasy/MDMA/Molly (<1%) Pharm party/skittles (<1%) Heroin (<1%)
Drug Use Youth reported ever using the following on school property: Vape products (4%) THC (2%) Alcohol (1%) Prescription drugs not prescribed for them (<1%) Illegal drugs (<1%) Cigarettes (<1%) Chewing tobacco (<1%) In the past year, 3% of youth reported they had been offered, sold, or given an illegal drug on school property
Drug Use Youth indicated the following reasons for not using alcohol, tobacco, or other drugs: Family would be upset (53%) Values (53%) Legal consequences (42%) Kicked out of extracurricular activities (34%) Friends would not approve (33%) Health problems (30%) Random drug testing (13%) Other (22%)
Drug Use High School State & National Comparisons Fulton County 2023 (9th-12th) 6th-12th Grade Fulton County Comparisons Fulton County 2012 (6th-12th) Fulton County 2014 (6th-12th) Fulton County 2016 (6th-12th) Fulton County 2018 (6th-12th) Fulton County 2021 (6th-12th) Fulton County 2023 (6th-12th) Ohio 2021 (9th-12th) U.S. 2021 (9th-12th) Youth Comparisons Currently used marijuana (in the past 30 days) Currently used prescription drugs not prescribed to them (in the past 30 days) Ever used methamphetamines (in their lifetime) Ever used cocaine (in their lifetime) Ever used heroin (in their lifetime) Ever used inhalants (in their lifetime) Ever used ecstasy (in their lifetime) Ever took prescription drugs without a doctor's prescription (in their lifetime) Were offered, sold, or given an illegal drug on school property (in the past 12 months) 4% 6% 7% 7% 6% 5% 13% 16% 3% 4% 6% 3% 3% 2% <1% <1% N/A N/A 1% <1% 1% 1% 1% <1% 1% 2% 2% 1% 2% 2% 1% 3% 1% 1% 1% 1% <1% 1% <1% 1% <1% 2% N/A 3% 1% 5% 7% 6% 7% <1% 1% 2% N/A 8% 2% 2% 2% <1% 1% <1% 1% N/A 3% 6% 8% 6% 7% 4% 4% 4% 10% 12% 5% 4% 4% 3% 5% 3% 3% N/A 14% N/A Not Available
Perceptions of Substance Use Perceived Disapproval by Parents and Friends Parents would disapprove of you doing the following: 13 or younger 14-16 years old 17 or older Total Female Male Smoke cigarettes 86% 90% 82% 83% 89% 86% Drink alcohol 76% 79% 73% 77% 78% 67% Use vape products 83% 86% 81% 81% 87% 79% Use marijuana/THC 83% 87% 79% 82% 86% 78% Misuse prescription drugs 87% 92% 82% 82% 90% 88% Friends would disapprove of you doing the following: 13 or younger 14-16 years old 17 or older Total Female Male Smoke cigarettes 78% 85% 71% 77% 82% 70% Drink alcohol 63% 69% 58% 72% 66% 39% Use vape products 71% 75% 67% 75% 76% 51% Use marijuana/THC 73% 79% 66% 77% 77% 54% Misuse prescription drugs 82% 88% 75% 78% 86% 79% Note: Caution should be used when interpreting subgroup results as the margin of error for any subgroup is higher than that of the overall survey.
Sexual Behavior 9% of Fulton County youth had sexual intercourse at least once in their lifetime 7% of youth had participated in other sexual activities (not including kissing or holding hands) Increasing to 18% of those ages 17 and older 7% of youth had participated in sexting Increasing to 17% of those ages 17 and older 12% of youth had viewed pornography Increasing to 22% of those ages 17 and older
Sexual Behavior Fulton County Youth Who Had Sexual Intercourse 40% 30% 26% 22% 20% 17% 17% 10% 9% 9% 10% 8% 8% 1% 0% Total Male Female 13 or younger 14-16 17 & older Fulton 2014Fulton 2016Fulton 2018Fulton 2021 Note: Caution should be used when interpreting subgroup results as the margin of error for any subgroup is higher than that of the overall survey.
Sexual Behavior Among youth who ever had sex, youth did the following to prevent pregnancy and/or STD s the last time they had sex: Used condoms (37%) Used birth control pills (21%) Used an IUD or implant (8%) Used the withdrawal method (7%) Used a shot, patch, or birth control ring (4%) Used some other method (6%) 7% of youth who ever had sex did not use a method of protection to prevent pregnancy and/or STD s the last time they had sex 6% of youth who indicated they had ever had sex reported drinking alcohol or using drugs before the last time they engaged in sexual intercourse
Sexual Behavior 67% of youth reported they are planning to stay abstinent until marriage Youth learned about pregnancy prevention, STDs, HIV/AIDS, and the use of condoms from the following: School (62%) Their parents/caregiver (48%) Their doctor (26%) The internet or social media (22%) Their friends (18%) Siblings (10%) Other trusted adult (9%) Church (5%) Somewhere else (4%) Etc. 16% of youth had not been taught about these subjects
Sexual Behavior Fulton County Youth Who Planned on Staying Abstinent Until Marriage 100% 79% 71% 75% 67% 66% 63% 60% 55% 52% 50% 45% 43% 40% 25% 0% Total Male Female 13 or younger 14-16 17 & older Fulton 2012 Fulton 2014 Fulton 2016 Fulton 2018 Fulton 2021 Note: Caution should be used when interpreting subgroup results as the margin of error for any subgroup is higher than that of the overall survey.
Sexual Behavior High School State & National Comparisons Fulton County 2023 (9th-12th) 6th-12th Grade Fulton County Comparisons Fulton County 2021 (6th-12th) Fulton County 2012 (6th-12th) Fulton County 2014 (6th-12th) Fulton County 2016 (6th-12th) Fulton County 2018 (6th-12th) Fulton County 2023 (6th-12th) Ohio 2021 (9th-12th) U.S. 2021 (9th-12th) Youth Comparisons Participated in some form of sexual activity Ever had sexual intercourse Had sexual intercourse for the first time before age 13 Planning to stay abstinent until marriage 30% 29% 17% 16% 10% 9% 14% N/A N/A N/A 22% 17% 17% 10% 9% 14% 33% 30% N/A N/A N/A N/A 3% 2% 1% 2% 3% 43% 40% 52% 55% 60% 67% 58% N/A N/A N/A Not Available
Sexual Behavior High School State & National Comparisons Fulton County 2023 (9th-12th) 6th-12th Grade Fulton County Comparisons Fulton County 2021 (6th-12th) Fulton County 2012 (6th-12th) Fulton County 2014 (6th-12th) Fulton County 2016 (6th-12th) Fulton County 2018 (6th-12th) Fulton County 2023 (6th-12th) Ohio 2021 (9th-12th) U.S. 2021 (9th-12th) Youth Comparisons Drank alcohol or used drugs (before last sexual intercourse, among youth who ever had sexual intercourse) Used a condom during last sexual intercourse (among youth who ever had sexual intercourse) Used birth control pills before last sexual intercourse (to prevent pregnancy, among youth who ever had sexual intercourse) Used an IUD (e.g., Mirena or ParaGard) or implant (e.g., Implanon or Nexplanon) before last sexual intercourse (to prevent pregnancy, among youth who ever had sexual intercourse) N/A N/A 11% 14% 16% 6% 6% 15%* 21%* N/A N/A N/A 37% 40% 37% 46% 58%* 52%* N/A N/A N/A 21% 28% 21% 26% 43%* 33%* N/A N/A N/A 2% 7% 8% 11% 8%* 9%* N/A Not Available *YRBS Ohio and US data is among youth who indicated they were sexually active (had sexual intercourse within the past three months)
Mental Health In the past year, 27% of youth reported feeling sad or hopeless almost every day for 2 weeks or more in a row that they stopped doing usual activities 11% of youth reported they had seriously considered attempting suicide in the past year 5% of youth attempted suicide and 3% made more than one attempt in the past year
Mental Health Fulton County Youth Who Felt Sad or Hopeless For Two Weeks or More in a Row 50% 38% 40% 32% 29% 29% 29% 30% 27% 24% 22% 19% 18% 20% 17% 10% 0% Total Male Female 13 or younger 14-16 17 & older Fulton 2012 Fulton 2014 Fulton 2016 Fulton 2018 Fulton 2021 Note: Caution should be used when interpreting subgroup results as the margin of error for any subgroup is higher than that of the overall survey.
