Impressive Impact of Recent El Niño-Fueled Storms in San Diego County
El Niño-driven storms in San Diego County led to above-average winter precipitation, with areas receiving over 5 inches of rain in just 3 days. This sudden increase has significantly boosted accumulated precipitation levels for the winter, especially in Southern California. The rapid rise in precipitation levels has caused rivers to swell and localized flooding in coastal areas. The storms also impacted the Los Angeles basin, increasing accumulated precipitation totals significantly. California saw widespread rain and snow, affecting regions from Washington to Northern Mexico. These developments can be tracked in real-time through CNAP and CW3E's San Diego Precipitation Page.

Download Presentation

Please find below an Image/Link to download the presentation.
The content on the website is provided AS IS for your information and personal use only. It may not be sold, licensed, or shared on other websites without obtaining consent from the author. Download presentation by click this link. If you encounter any issues during the download, it is possible that the publisher has removed the file from their server.
E N D
Presentation Transcript
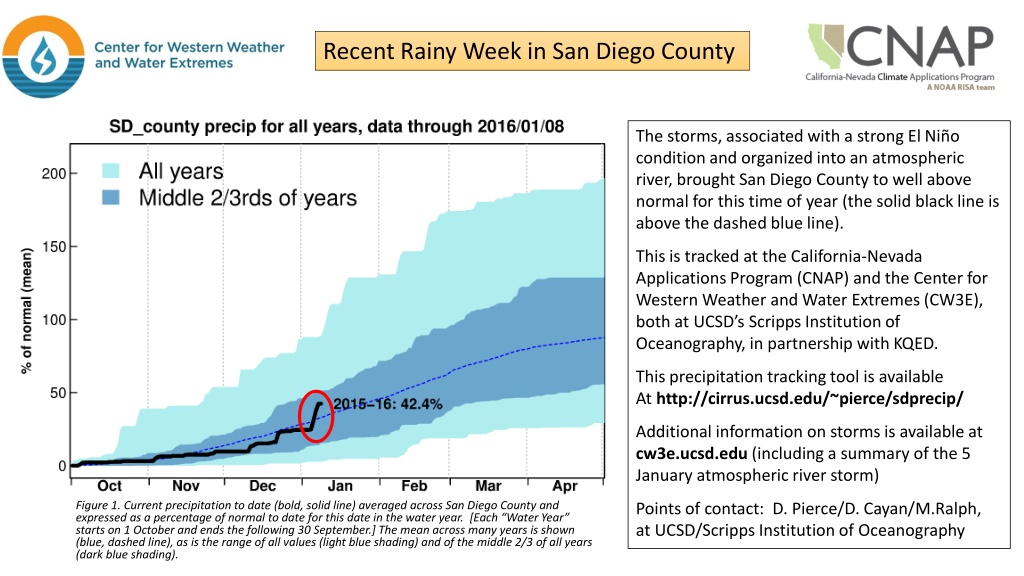
Recent Rainy Week in San Diego County The storms, associated with a strong El Ni o condition and organized into an atmospheric river, brought San Diego County to well above normal for this time of year (the solid black line is above the dashed blue line). This is tracked at the California-Nevada Applications Program (CNAP) and the Center for Western Weather and Water Extremes (CW3E), both at UCSD s Scripps Institution of Oceanography, in partnership with KQED. This precipitation tracking tool is available At http://cirrus.ucsd.edu/~pierce/sdprecip/ Additional information on storms is available at cw3e.ucsd.edu (including a summary of the 5 January atmospheric river storm) Figure 1. Current precipitation to date (bold, solid line) averaged across San Diego County and expressed as a percentage of normal to date for this date in the water year. [Each Water Year starts on 1 October and ends the following 30 September.] The mean across many years is shown (blue, dashed line), as is the range of all values (light blue shading) and of the middle 2/3 of all years (dark blue shading). Points of contact: D. Pierce/D. Cayan/M.Ralph, at UCSD/Scripps Institution of Oceanography
Several locations received over 5 inches of rain in 3 days San Diego Region Los Angeles Region Figure 2. 72-hour accumulated precipitation totals (inches) in the greater San Diego region for the 3 days ending on 7 January 2016. Data and figure are from the California Nevada River Forecast Center (CNRFC) web site (www.cnrfc.noaa.gov). Figure 3. Same as Fig. 2, but for the greater Los Angeles region.
El Nio-fueled storms over the last few days, including a land-falling atmospheric river on 5 January have made an impressive contribution in Southern California's winter precipitation totals, including locations receiving 5-7 inches of precipitation in 3 days (See Figures 2 and 3). In the last three days, San Diego county has received almost 17% of the amount of precipitation it receives in an entire year, on average. That brings the county's accumulated precipitation so far this winter to 42% of the total received over an entire average year. This is an above-average value for the first time since the winter started; typically, by this point in the winter, San Diego will have accumulated 32% of the average year-end total precipitation. (See Figure 1.) The Los Angeles basin has been affected even more strongly. Before the recent storms hit, the accumulated precipitation since the winter started was only 11% of the typical end-of-winter total, far below the average value of 29%. In three days the accumulation has jumped to 27%. This rapid increase is more than has been experienced in 95 out of 100 past wet periods of 3- day duration in the region, leading to strong flows in the normally quiescent Los Angeles river and localized flooding in Southern California coastal areas. (See Figure 4.) Precipitation during the week was widespread, with rain and snow delivered from Washington to Northern Mexico. California statewide totals also were boosted during the Jan 4-7 period (http://cnap.ucsd.edu), although amounts were not as heavy in Northern California as they were in Southern California.
These accumulated precipitation totals can be tracked in real time from the California-Nevada Applications Project (CNAP) and Center for Western Weather and Water Extremes (CW3E)'s "San Diego Precipitation Page" (cirrus.ucsd.edu/~pierce/sdprecip/). This includes monitoring of how current water year precipitation compares to that during the last 5 strongest El Nino winters (See Figure 4). Precipitation gauge records compiled by the California Nevada River Forecast Center (www.cnrfc.noaa.gov) show accumulations of 3-5" over much of the Los Angeles basin in the past 72 hours, reaching 7" in some locations in the surrounding mountains (Figure 3). San Diego county accumulations are 1-3" over much of the city, and 4-5" in the North County interior (Figure 2). The current El Ni o is one of the three strongest in records that go back to 1950, registering broad unusually warm surface waters and highly anomalous winds and other atmospheric conditions in the tropical Pacific. El Nino events can alter the North Pacific winter storm track and produce unusually wet winters in Southern California about 60% of the time, compared to about 11% of the time during years when no El Nino or its opposite, La Nina, is present. Forecasts indicate that El Nino conditions are likely to persist through the spring of 2016, before fading in the early summer of 2016.
Figure 4. Comparison of current water year precipitation to date (solid black lines) to actual full year precipitation from the 5 past strongest El Nino winters (top panels) and from all winters (lower panels; see Fig. 1 caption for more detail on lower panel format). Left panels are for the San Diego County area. Right panels are for the Los Angeles region. http://cnap.ucsd.edu