Thursday Case of the Day
A case study investigates a PET/CT artifact caused by misregistration between PET and CT images due to rectum gas motion, leading to attenuation correction errors. Experimental evidence and images illustrate this phenomenon.

Download Presentation

Please find below an Image/Link to download the presentation.
The content on the website is provided AS IS for your information and personal use only. It may not be sold, licensed, or shared on other websites without obtaining consent from the author.If you encounter any issues during the download, it is possible that the publisher has removed the file from their server.
You are allowed to download the files provided on this website for personal or commercial use, subject to the condition that they are used lawfully. All files are the property of their respective owners.
The content on the website is provided AS IS for your information and personal use only. It may not be sold, licensed, or shared on other websites without obtaining consent from the author.
E N D
Presentation Transcript
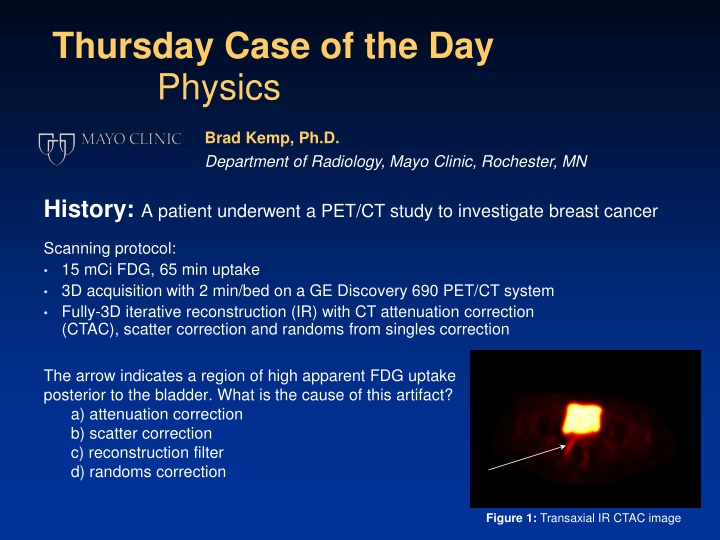
Thursday Case of the Day Physics Brad Kemp, Ph.D. Department of Radiology, Mayo Clinic, Rochester, MN History: A patient underwent a PET/CT study to investigate breast cancer Scanning protocol: 15 mCi FDG, 65 min uptake 3D acquisition with 2 min/bed on a GE Discovery 690 PET/CT system Fully-3D iterative reconstruction (IR) with CT attenuation correction (CTAC), scatter correction and randoms from singles correction The arrow indicates a region of high apparent FDG uptake posterior to the bladder. What is the cause of this artifact? a) attenuation correction b) scatter correction c) reconstruction filter d) randoms correction Figure 1: Transaxial IR CTAC image
Findings:The correct answer is a) This artifact is caused by the attenuation correction as there is a misregistration between PET and CT images. A B C Figure 2: (A) Transaxial IR CTAC PET image. (B) Transaxial fused PET/CT image. (C) Transaxial PET image with no attenuation correction (NAC). The motion of gas within the patient s rectum between the CT and the PET images causes a mismatch in the attenuation distribution and a subsequent error in the attenuation correction. Note that this misregistration is due to internal organ motion and not gross patient motion. The motion of gas is apparent in the fused PET/CT image in Figure 2B. The PET images are overcorrected for attenuation in the region where the low-attenuation gas pocket was located for the PET acquisition. The IR NAC PET image shows symmetric perirectal activity (Figure 2C).
Discussion Lodge conducted an experiment to show that the artifact is caused by an attenuation correction error due to motion between CT and PET acquisitions [1]. See Figure 3 and 4. The results of the experimental suggest that the movement of gas within the rectum causes differences in the attenuation distribution between the CT and PET acquisitions. As such, the hot streak represents a region that is over-corrected for attenuation. Figure 3: CT image showing body phantom with two cylindrical inserts. The upper insert contained radioactive water while the lower insert was a low attenuation medium. Red arrow shows direction of motion of PET distribution prior to attenuation correction. Figure 4: Reconstructed PET images of the body phantom with increasing amounts of misregistration between PET and CT data. Hot and cold artifacts, as shown by the red arrows, increase as the misregistration increases.
Discussion C A B Figure 5: (A) Transaxial IR CTAC PET image. (B) Transaxial fused PET/CT image. (C) Transaxial IR NAC PET image. Figure 5 shows images from a PET/CT exam in which the gas pocket within the rectum is stationary; the PET and CT images are properly registered and there is no error in the attenuation correction of the PET images. Reference Lodge MA, Muhammad AC, Udall DN, Wahl RL. Characterization of a perirectal artifact in 18F-FDG PET/CT. J Nucl Med 2010;51:1501-1506.

")