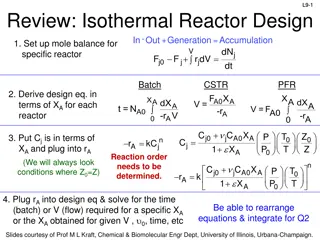
Reactor Design Fundamentals: Rate Laws and Analysis
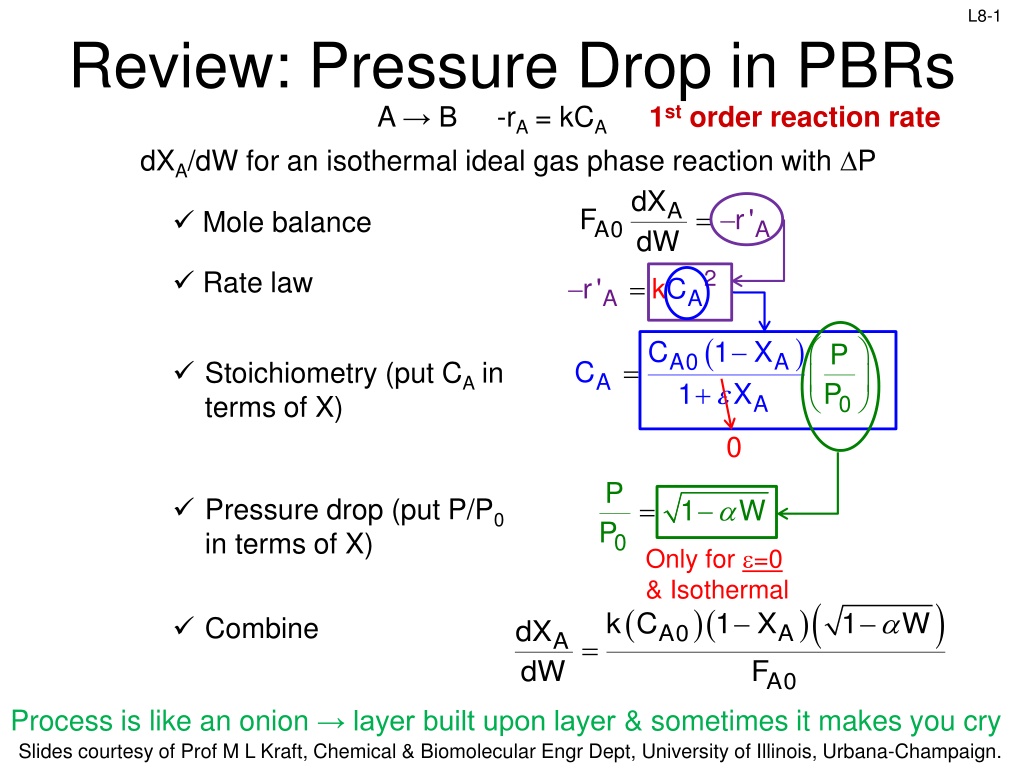


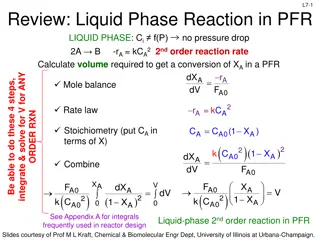
Review: Pressure Drop in PBRs
A
→ B -r
A
= kC
A
dX
A
/dW for an isothermal ideal gas phase reaction with
P
1
s
t
o
r
d
e
r
r
e
a
c
t
i
o
n
r
a
t
e
Mole balance
Rate law
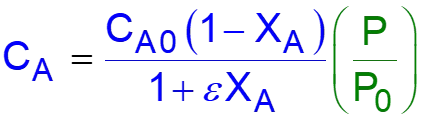
Stoichiometry (put C
A
in
terms of X)
Combine


Pressure drop (put P/P
0
in terms of X)


Only for
=0
& Isothermal

0


Process is like an onion
→ layer built upon layer
& sometimes it makes you cry


Review: Pressure Drop in PBRs
A
→ B -r
A
= kC
A
dX
A
/dW for an isothermal ideal gas phase reaction with
P
1
s
t
o
r
d
e
r
r
e
a
c
t
i
o
n
r
a
t
e
Mole balance
Rate law
Stoichiometry (put C
A
in
terms of X)
Combine


Pressure drop (put P/P
0
in terms of X)
Only for
=0
& Isothermal

0


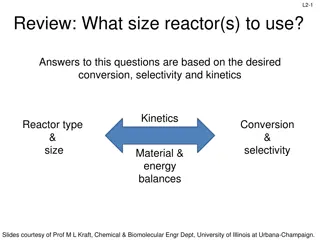
How do we determine the reaction order?
L8: Analysis of Rate Data
Goal: how to determine rate laws
In practice, collection and analysis of rate data is the most time consuming
task in reactor design
BMB
Kinetics
Stoichiometry
Fluid dynamics
Reactor volume
Reactor design
problem
BMB
Reactor Volume
Stoichiometry
Fluid dynamics
Kinetics
BEFORE
Reactor design
problem
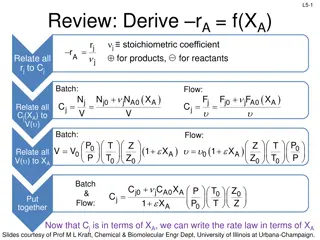
Review of Rate Laws
The reaction:
i
s
e
l
e
m
e
n
t
a
r
y
a
n
d
i
r
r
e
v
e
r
s
i
b
l
e
.
W
h
i
c
h
o
f
t
h
e
f
o
l
l
o
w
i
n
g
i
s
t
r
u
e
?
a)
b)
c)
d)
The rate cannot be determined from this information
e)
None of the above
Ethanol
and
acetic acid
react to form
ethyl acetate
and
water
. The
rate of
ethyl acetate
formation is 1
st
order in
ethanol conc
and
0
th
order in
acetic acid conc
. Which of the following is true?
a)
r
ethyl acetate
= k
C
ethyl
acetate
C
water
b)
r
ethyl acetate
= k
C
ethanol
C
acetic acid
c)
r
ethyl acetate
= k
C
ethanol
d)
r
ethyl acetate
= k
C
acetic acid
e)
r
ethyl acetate
= k
C
ethanol
2
C
acetic acid
-1
C
a
c
e
t
i
c
a
c
i
d
0
(
z
e
r
o
p
o
w
e
r
)
=
1
Collection & Analysis of Rate Data
•
Constant-volume batch reactor
–
For homogenous reactions
–
Concentration vs. time measurements
–
Measurement during the unsteady-state operation
•
Differential reactor
–
For solid-fluid reactions
–
Measurement during steady state operation
–
Product concentration is usually monitored for different feed conditions
Data collection is done in the lab, where we can simplify BMB,
stoichiometry, and fluid dynamic considerations
Goal
: determine reaction order,
, and specific reaction rate
constant, k, in the rate law
•
Want ideal conditions
→
well-mixed (data is easiest to interpret)
•
Select a simple reactor
Method of Excess
A + B
→ products Suspect rate eq. -r
A
= kC
A
C
B
1.
Run reaction with an excess of B so C
B
≈ C
B0
2.
Rate equation simplifies to –r
A
= k’
C
A
where k’=k
A
C
B
≈
k’=k
A
C
B0
and
can be determined
3.
Repeat, but with an excess of A so that
C
A
≈ C
A0
4.
With excess A, rate simplifies to –r
A
= k’’C
B
where k’’=k
A
C
A
≈ k’’=k
A
C
A0
5.
Determine k
A
by measuring –r
A
at known concentrations of A and B, where
Analysis Methods
•
Differential method
•
Integral method
•
Half-lives method
•
Initial rate method
•
Differential reactor
•
More complex kinetics
Differential Method
0
0
Where –r
A
= kC
A
alpha power
b)
Determine dC
A
/dt from plot by graphical or numerical methods
c)
Plot ln(-dC
A
/dt) vs ln C
A
Average slope
Slope =
To find k, find the value of –dC
A,p
/dt that corresponds to a specific
concentration C
A,p
. Raise C
A,p
to the
power and divide into –dC
A
/dt)
p
H
e
y
,
w
e
j
u
s
t
j
u
m
p
e
d
f
r
o
m
s
t
e
p
a
t
o
s
t
e
p
c
.
H
o
w
d
o
w
e
g
e
t
d
C
A
/
d
t
?
a)
P
l
o
t
C
A
/
t
a
s
a
f
u
n
c
t
i
o
n
o
f
t
3.
dC
A
/dt is read using the value
where the curve crosses a
specified time
Graphical Method
1.
Plot
C
A
/
t vs t
2.
Draw rectangles on the
graph. Then draw a curve so
that the area above the curve
that is cut off of each
rectangle approximately fills
the unfilled area under the
curve
C
A
/
t)
t=0
C
A
/
t)
t=1
C
A
/
t)
t=2
Graphical Method Example
Graphical Method Example
Graphical Method Example
Graphical Method Example
-
Graphical Method Example
-
Graphical Method Example
Slope =
-
Plot ln(-dC
A
/dt) vs ln C
A
Graphical Method Example
Slope
=
=
1.0
Plot ln(-dC
A
/dt) vs ln C
A
-
r
A
=
(
0.6/time
)
C
A
Graphical Method Example
Slope =
D
i
f
f
e
r
e
n
t
i
a
l
M
e
t
h
o
d
O
n
l
y
f
o
r
i
r
r
e
v
e
r
s
i
b
l
e
r
e
a
c
t
i
o
n
s
Advantages: 1 experiment
Disadvantages: can only handle
simple kinetics
-
-
Analysing methods
Differential method
•
Integral method
•
Half-lives method
•
Initial rate method
•
Differential reactor
•
More complex kinetics
Integral Method
•
A
trial-and-error
procedure to find reaction order
•
G
u
e
s
s
t
h
e
r
e
a
c
t
i
o
n
o
r
d
e
r
→
i
n
t
e
g
r
a
t
e
t
h
e
d
i
f
f
e
r
e
n
t
i
a
l
e
q
u
a
t
i
o
n
•
Method is used most often when reaction order is known
and it is desired to evaluate the specific reaction rate
constants (k) at different temps to determine the activation
energy
•
Looking for the appropriate function of concentration
corresponding to a particular rate law that is linear with time
For the reaction
A
products
For a first-order reaction - r
A
= k C
A
For a second-order reaction - r
A
= k C
A
2
For a zero-order reaction -r
A
= k
Plot of C
A
vs
t is a straight
line
Plot of
ln(C
A0
/C
A
) vs t
is a straight line
Plot of 1/C
A
vs t
is a straight line
Analysis Methods
Differential method
Integral method
•
Half-lives method
•
Initial rate method
•
Differential reactor
•
More complex kinetics
Method of Half-lives
•
The half-life of a reaction, t
1/2
, is defined as the
time it takes for the concentration of the reactant
to fall to half of its initial value
•
By determining the half-life of a reaction as a
function of the initial concentration, the reaction
order and specific reaction rate can be
determined
A
products
Plot ln(t
1/2
) vs ln C
A0
. Get a straight
line with a slope of 1-
α
Analysis Methods
Differential method
Integral method
Half-lives method
•
Initial rate method
•
Differential reactor
•
More complex kinetics
Method of Initial Rates
•
When the reaction is
reversible
, the method of initial rates
can be used to determine the reaction order and the specific
rate constant
•
Very little product is initially present, so rate of reverse
reaction is negligible
–
A series of experiments is carried out at different initial
concentrations
–
Initial rate of reaction
is determined for
each
run
–
Initial rate can be found by differentiating the data and
extrapolating to zero time
–
By various plotting or numerical analysis techniques relating -r
A0
to C
A0
, we can obtain the appropriate rate law:
Example: Initial Rate Method
4HCl + CaMg(CO
3
)
2
Mg
2+
+ Ca
2+
+ 4Cl
-
+2CO
3
+ 2H
2
O
The dissolution of dolomite using hydrochloric acid:
Concentration of HCl at various times was determined from atomic
absorption spectrophotometer measurements of the Ca
2+
and Mg
2+
ions
C
HCl
t
4
N HCl
1
N HCl
Make a plot of ln (-r
A0
) vs ln C
A0
The slope =
Evaluating the mole balance on a constant V batch reactor at t = 0:
P
l
o
t
o
f
l
n
(
-
r
H
C
l
,
0
)
v
s
l
n
C
H
C
l
,
0
w
i
l
l
g
i
v
e
r
e
a
c
t
i
o
n
o
r
d
e
r
&
k
Analysis Methods
Differential method
Integral method
Half-lives method
Initial rate method
•
Differential reactor
•
More Complex Kinetics
Differential Reactors
•
The criterion for a reactor being differential is that the conversion
of the reactants in the bed is extremely small, as is the change in
reactant concentration through the bed
•
Reactant concentration through the reactor is essentially
constant (i.e. the reactor is considered to be gradient-less)
•
Can treat the mole balance like a CSTR
•
Rate of reaction determined for a specified number of pre-
determined initial or entering reactant concentrations
•
Determine rate of reaction as a function concentration or partial
pressure
•
Operate isothermally
C
A0
~ C
A
~ C
Ae
Differential Catalyst Bed
The rate of reaction per unit mass of catalyst, r’
A
flow rate in - flow rate out + rate of generation = rate of accumulation
When constant flow rate,
0
=
:
Product
concentration
T
h
e
r
e
a
c
t
i
o
n
r
a
t
e
i
s
d
e
t
e
r
m
i
n
e
d
b
y
m
e
a
s
u
r
i
n
g
p
r
o
d
u
c
t
c
o
n
c
e
n
t
r
a
t
i
o
n
,
C
p
More Complex Kinetics
•
Carry out batch experiments
•
Use optimization software to compute kinetic parameters by least squares
(covered in process control)
•
Investigate errors by calculating standard deviations of parameters and
looking at magnitudes of r
a,meas,i
–r
A, calc,i
to look for outliers (will learn in
process design, this is FYI for this class
•
If parameters are sufficiently accurate, then stop. If not, keep repeating
the procedure
Sum of squares difference between the measured values and calculated values
This content covers the analysis of pressure drop in packed bed reactors, determining reaction order, and studying rate data for reactor design. It delves into stoichiometry, kinetics, fluid dynamics, and the challenges of collecting and analyzing rate data. Examples of rate laws and reactions are provided for a comprehensive understanding of reactor design principles.

Download Presentation

Please find below an Image/Link to download the presentation.
The content on the website is provided AS IS for your information and personal use only. It may not be sold, licensed, or shared on other websites without obtaining consent from the author.If you encounter any issues during the download, it is possible that the publisher has removed the file from their server.
You are allowed to download the files provided on this website for personal or commercial use, subject to the condition that they are used lawfully. All files are the property of their respective owners.
The content on the website is provided AS IS for your information and personal use only. It may not be sold, licensed, or shared on other websites without obtaining consent from the author.
E N D
Presentation Transcript
L8-1 Review: Pressure Drop in PBRs A B -rA = kCA dXA/dW for an isothermal ideal gas phase reaction with P 1st order reaction rate dX d A = F r' Mole balance A0 A W 2 Rate law = r' kC A A ( ) X C 1 X P P A0 1 A = C Stoichiometry (put CA in terms of X) A + A 0 0 P P = Pressure drop (put P/P0 in terms of X) 1 W 0 Only for =0 & Isothermal )( ) ( )( 1 X k C 1 W Combine dX dW A0 A A = F A0 Process is like an onion layer built upon layer & sometimes it makes you cry Slides courtesy of Prof M L Kraft, Chemical & Biomolecular Engr Dept, University of Illinois, Urbana-Champaign.
L8-2 Review: Pressure Drop in PBRs A B -rA = kCA dXA/dW for an isothermal ideal gas phase reaction with P 1st order reaction rate dX d A = F r' Mole balance A0 A W 2 Rate law = r' kC A A ( ) X C 1 X P P A0 1 A = C Stoichiometry (put CA in terms of X) A + A 0 0 P P = Pressure drop (put P/P0 in terms of X) 1 W 0 Only for =0 & Isothermal )( ) ( )( 1 X k C 1 W Combine dX dW A0 A A = F A0 How do we determine the reaction order? Slides courtesy of Prof M L Kraft, Chemical & Biomolecular Engr Dept, University of Illinois, Urbana-Champaign.
L8-3 L8: Analysis of Rate Data Goal: how to determine rate laws In practice, collection and analysis of rate data is the most time consuming task in reactor design BMB Kinetics Stoichiometry Fluid dynamics Reactor design problem Reactor volume BMB BEFORE Reactor design problem Reactor Volume Stoichiometry Fluid dynamics Kinetics Slides courtesy of Prof M L Kraft, Chemical & Biomolecular Engr Dept, University of Illinois, Urbana-Champaign.
L8-4 Review of Rate Laws ( ) C H g C H 2 6 2 4 k ( ) g ( ) g + The reaction: is elementary and irreversible. Which of the following is true? a) b) c) 2 6 2 6 H 2 r kC kC C C = = = C H -r r C H H 2 6 C H C H 2 4 2 C H C H 2 6 2 6 d) The rate cannot be determined from this information e) None of the above Ethanol and acetic acid react to form ethyl acetate and water. The rate of ethyl acetate formation is 1st order in ethanol conc and 0th order in acetic acid conc. Which of the following is true? a) rethyl acetate = kCethylacetateCwater b) rethyl acetate = kCethanolCacetic acid c) rethyl acetate = kCethanol d) rethyl acetate = kCacetic acid e) rethyl acetate = kCethanol2Cacetic acid-1 Caceticacid0 (zero power) = 1 Slides courtesy of Prof M L Kraft, Chemical & Biomolecular Engr Dept, University of Illinois, Urbana-Champaign.
L8-5 Collection & Analysis of Rate Data Data collection is done in the lab, where we can simplify BMB, stoichiometry, and fluid dynamic considerations Goal: determine reaction order, , and specific reaction rate constant, k, in the rate law Want ideal conditions well-mixed (data is easiest to interpret) Select a simple reactor Constant-volume batch reactor For homogenous reactions Concentration vs. time measurements Measurement during the unsteady-state operation Differential reactor For solid-fluid reactions Measurement during steady state operation Product concentration is usually monitored for different feed conditions Slides courtesy of Prof M L Kraft, Chemical & Biomolecular Engr Dept, University of Illinois, Urbana-Champaign.
L8-6 Method of Excess A + B products Suspect rate eq. -rA = kCA CB 1.Run reaction with an excess of B so CB CB0 2.Rate equation simplifies to rA = k CA where k =kACB k =kACB0 and can be determined 3.Repeat, but with an excess of A so that CA CA0 4.With excess A, rate simplifies to rA = k CB where k =kACA k =kACA0 5.Determine kA by measuring rA at known concentrations of A and B, where ) ( + r 1 1 s 3 A C = = k dm mol A C A B Slides courtesy of Prof M L Kraft, Chemical & Biomolecular Engr Dept, University of Illinois, Urbana-Champaign.
L8-7 Analysis Methods Differential method Integral method Half-lives method Initial rate method Differential reactor More complex kinetics Slides courtesy of Prof M L Kraft, Chemical & Biomolecular Engr Dept, University of Illinois, Urbana-Champaign.
L8-8 Differential Method d F F r V N dt 0 0 dC dt d dt ( ) j + = = = r V C V r V V j0 j j j j j j alpha power dC dt Average slope dC dt j A = r Where rA = kCA = kC j A Plot CA/ t as a function of t a) b) c) Determine dCA/dt from plot by graphical or numerical methods Plot ln(-dCA/dt) vs ln CA dC C dt dC dt = A = A k + ln lnk lnC Slope = A A To find k, find the value of dCA,p/dt that corresponds to a specific concentration CA,p. Raise CA,p to the power and divide into dCA/dt)p Hey, we just jumped from step a to step c. How do we get dCA/dt? Slides courtesy of Prof M L Kraft, Chemical & Biomolecular Engr Dept, University of Illinois, Urbana-Champaign.
L8-9 Graphical Method C A t 1. Plot CA/ t vs t 2. Draw rectangles on the graph. Then draw a curve so that the area above the curve that is cut off of each rectangle approximately fills the unfilled area under the curve ( CA/ t)t=0 dC dt 0 A t ( CA/ t)t=1 dC dt 1 2 ( CA/ t)t=2 A t dC dt A t 3. dCA/dt is read using the value where the curve crosses a specified time 0 t1 t2 Slides courtesy of Prof M L Kraft, Chemical & Biomolecular Engr Dept, University of Illinois, Urbana-Champaign.
L8-10 Graphical Method Example t CA CA/ t CA 8 4 2 1 t 0 1 2 3 -dCA/dt Slides courtesy of Prof M L Kraft, Chemical & Biomolecular Engr Dept, University of Illinois, Urbana-Champaign.
L8-11 Graphical Method Example t CA CA/ t CA 8 4 2 1 t 0 1 2 3 -dCA/dt 1-0=1 2-1=1 1 Slides courtesy of Prof M L Kraft, Chemical & Biomolecular Engr Dept, University of Illinois, Urbana-Champaign.
L8-12 Graphical Method Example t 1 1 1 CA 4-8= -4 2-4= -2 1-2= -1 CA/ t CA 8 4 2 1 t 0 1 2 3 -dCA/dt Slides courtesy of Prof M L Kraft, Chemical & Biomolecular Engr Dept, University of Illinois, Urbana-Champaign.
L8-13 Graphical Method Example t 1 1 1 t 1 1 CA -4 -2 -1 1 CA/ t 4 2 1 -1 CA -4 -2 CA/ t 4 2 1 CA 8 4 2 CA 8 4 2 1 1 t 0 1 2 3 t 0 1 2 3 -dCA/dt - Slides courtesy of Prof M L Kraft, Chemical & Biomolecular Engr Dept, University of Illinois, Urbana-Champaign.
L8-14 Graphical Method Example t 1 1 1 t 1 1 CA -4 -2 -1 1 CA/ t 4 2 1 -1 CA -4 -2 CA/ t 4 2 1 CA 8 4 2 CA 8 4 2 1 1 t 0 1 2 3 t 0 1 2 3 -dCA/dt 4.5 2.55 1.35 0.5 - Slides courtesy of Prof M L Kraft, Chemical & Biomolecular Engr Dept, University of Illinois, Urbana-Champaign.
L8-15 Graphical Method Example t 1 1 1 CA -4 -2 -1 CA/ t 4 2 1 CA 8 4 2 1 t 0 1 2 3 -dCA/dt 4.5 2.55 1.35 0.5 dC dt A = kC A dC dt = A + ln lnk lnC A Plot ln(-dCA/dt) vs ln CA - Slope = dC C dt A = k A Slides courtesy of Prof M L Kraft, Chemical & Biomolecular Engr Dept, University of Illinois, Urbana-Champaign.
L8-16 Graphical Method Example t 1 1 1 CA -4 -2 -1 CA/ t 4 2 1 CA 8 4 2 1 t 0 1 2 3 -dCA/dt 4.5 2.55 1.35 0.5 ln(-dCA/dt) 1.5 0.9 0.3 -0.7 ln(CA) 2.1 1.4 0.7 0 Plot ln(-dCA/dt) vs ln CA dC dt = A + ln lnk lnC A Slope = = 1.0 dC C dt A = k A . 4 5 8 -rA= (0.6/time)CA k . = = 0 6 1 Slides courtesy of Prof M L Kraft, Chemical & Biomolecular Engr Dept, University of Illinois, Urbana-Champaign.
L8-17 Graphical Method Example dC dt = t 1 1 1 CA -4 -2 -1 CA/ t 4 2 1 CA 8 4 2 1 t 0 1 2 3 -dCA/dt 4.5 2.55 1.35 0.5 A + ln lnk lnC A Slope = dC C dt A = k A Differential Method Only for irreversible reactions Advantages: 1 experiment - - Disadvantages: can only handle simple kinetics Slides courtesy of Prof M L Kraft, Chemical & Biomolecular Engr Dept, University of Illinois, Urbana-Champaign.
L8-18 Analysing methods Differential method Integral method Half-lives method Initial rate method Differential reactor More complex kinetics Slides courtesy of Prof M L Kraft, Chemical & Biomolecular Engr Dept, University of Illinois, Urbana-Champaign.
L8-19 Integral Method A trial-and-error procedure to find reaction order Guess the reaction order integrate the differential equation Method is used most often when reaction order is known and it is desired to evaluate the specific reaction rate constants (k) at different temps to determine the activation energy Looking for the appropriate function of concentration corresponding to a particular rate law that is linear with time Slides courtesy of Prof M L Kraft, Chemical & Biomolecular Engr Dept, University of Illinois, Urbana-Champaign.
dC dt L8-20 A = r For the reaction A products A dC dt For a zero-order reaction -rA = k A = k Plot of CA vs t is a straight line CA = C C kt A A0 t dC dt For a first-order reaction - rA = k CA ln (CA0/CA) Plot of ln(CA0/CA) vs t is a straight line A = kC A C C A0 = ln kt t A dC dt 2 For a second-order reaction - rA = k CA2 1/CA A = kC A Plot of 1/CA vs t is a straight line 1 1 = kt C C t A A0 Slides courtesy of Prof M L Kraft, Chemical & Biomolecular Engr Dept, University of Illinois, Urbana-Champaign.
L8-21 Analysis Methods Differential method Integral method Half-lives method Initial rate method Differential reactor More complex kinetics Slides courtesy of Prof M L Kraft, Chemical & Biomolecular Engr Dept, University of Illinois, Urbana-Champaign.
L8-22 Method of Half-lives The half-life of a reaction, t1/2, is defined as the time it takes for the concentration of the reactant to fall to half of its initial value By determining the half-life of a reaction as a function of the initial concentration, the reaction order and specific reaction rate can be determined Slides courtesy of Prof M L Kraft, Chemical & Biomolecular Engr Dept, University of Illinois, Urbana-Champaign.
L8-23 Method of Half-lives The half-life of a reaction, t1/2, is defined as the time it takes for the concentration of the reactant to fall to half of its initial value By determining the half-life of a reaction as a function of the initial concentration, the reaction order and specific reaction rate can be determined Slides courtesy of Prof M L Kraft, Chemical & Biomolecular Engr Dept, University of Illinois, Urbana-Champaign.
L8-24 1 1 1 A products dC dt = t A = kC ( ) 1 1 A k 1 C C A A0 = r kC A A 1 2 = C C at t = t A A0 12 ln (t1/2) Slope = 1- 1 2 k 1 1 = 12 t ( ) 1 1 C A0 ln CA0 1 2 k 1 ( ) ( ) = + ln t ln 1 lnC 1 2 A0 ( ) Plot ln(t1/2) vs ln CA0. Get a straight line with a slope of 1- 1 Slides courtesy of Prof M L Kraft, Chemical & Biomolecular Engr Dept, University of Illinois, Urbana-Champaign.
L8-25 Analysis Methods Differential method Integral method Half-lives method Initial rate method Differential reactor More complex kinetics Slides courtesy of Prof M L Kraft, Chemical & Biomolecular Engr Dept, University of Illinois, Urbana-Champaign.
L8-26 Method of Initial Rates When the reaction is reversible, the method of initial rates can be used to determine the reaction order and the specific rate constant Very little product is initially present, so rate of reverse reaction is negligible A series of experiments is carried out at different initial concentrations Initial rate of reaction is determined for each run Initial rate can be found by differentiating the data and extrapolating to zero time By various plotting or numerical analysis techniques relating -rA0 to CA0, we can obtain the appropriate rate law: = A0 r kC A0 Slides courtesy of Prof M L Kraft, Chemical & Biomolecular Engr Dept, University of Illinois, Urbana-Champaign.
L8-27 Example: Initial Rate Method The dissolution of dolomite using hydrochloric acid: 4HCl + CaMg(CO3)2 Mg2+ + Ca2+ + 4Cl-+2CO3 + 2H2O Concentration of HCl at various times was determined from atomic absorption spectrophotometer measurements of the Ca2+ and Mg2+ ions 4 N HCl A0 r = kC A0 CHCl 1 N HCl Make a plot of ln (-rA0) vs ln CA0 The slope = t Slides courtesy of Prof M L Kraft, Chemical & Biomolecular Engr Dept, University of Illinois, Urbana-Champaign.
L8-28 Evaluating the mole balance on a constant V batch reactor at t = 0: dC dC HCl dt HCl dt = = = + HCl 0 (r ) kC ln lnk lnC HCl,0 HCl,0 0 0 CHCl, 0 Initial reaction rate rHCl,0 (mol/cm2 s) x 107 (N) 1 4 2 0.1 0.5 1.2 2.0 1.36 0.36 0.74 Plot of ln (-rHCl,0) vs ln CHCl,0 will give reaction order & k ln (-rHCl,0) Slope = ln (CHCl) Slides courtesy of Prof M L Kraft, Chemical & Biomolecular Engr Dept, University of Illinois, Urbana-Champaign.
L8-29 Analysis Methods Differential method Integral method Half-lives method Initial rate method Differential reactor More Complex Kinetics Slides courtesy of Prof M L Kraft, Chemical & Biomolecular Engr Dept, University of Illinois, Urbana-Champaign.
L8-30 Differential Reactors The criterion for a reactor being differential is that the conversion of the reactants in the bed is extremely small, as is the change in reactant concentration through the bed Reactant concentration through the reactor is essentially constant (i.e. the reactor is considered to be gradient-less) Can treat the mole balance like a CSTR Rate of reaction determined for a specified number of pre- determined initial or entering reactant concentrations Determine rate of reaction as a function concentration or partial pressure Operate isothermally CA CA0 CAe CA0 ~ CA~ CAe Slides courtesy of Prof M L Kraft, Chemical & Biomolecular Engr Dept, University of Illinois, Urbana-Champaign.
L8-31 Differential Catalyst Bed The rate of reaction per unit mass of catalyst, r A flow rate in - flow rate out + rate of generation = rate of accumulation + = F F r W 0 A0 Ae A F F C C A0 Ae 0 A0 Ae = = r A W W When constant flow rate, 0 = : ( ) Product concentration 0 p C W C C 0 A0 Ae A = = r W The reaction rate is determined by measuring product concentration, Cp Slides courtesy of Prof M L Kraft, Chemical & Biomolecular Engr Dept, University of Illinois, Urbana-Champaign.
L8-32 More Complex Kinetics Carry out batch experiments Use optimization software to compute kinetic parameters by least squares (covered in process control) #data pts ( ) 2 A,measurement i r A,calc,i r i 1 = Sum of squares difference between the measured values and calculated values Investigate errors by calculating standard deviations of parameters and looking at magnitudes of ra,meas,i rA, calc,i to look for outliers (will learn in process design, this is FYI for this class If parameters are sufficiently accurate, then stop. If not, keep repeating the procedure Slides courtesy of Prof M L Kraft, Chemical & Biomolecular Engr Dept, University of Illinois, Urbana-Champaign.