Functional Measurement Systems Analysis for Curve Data Using Random Effects Models
Measurement Systems Analysis (MSA) is crucial in determining the contribution of measurement variation to overall process variation. When dealing with curve data instead of single points, a Functional MSA approach using random effects models can be applied. This involves estimating mean curves, modeling residual curves, and expanding the functional model using eigenfunctions. By combining traditional MSA methods with Functional Data Analysis, a detailed analysis can be performed to assess the measurement system's effectiveness. Various aspects such as creating confidence intervals for %GRR, accounting for within-function correlation, or addressing cyclical nature of residuals can be explored in future research.
Download Presentation

Please find below an Image/Link to download the presentation.
The content on the website is provided AS IS for your information and personal use only. It may not be sold, licensed, or shared on other websites without obtaining consent from the author.If you encounter any issues during the download, it is possible that the publisher has removed the file from their server.
You are allowed to download the files provided on this website for personal or commercial use, subject to the condition that they are used lawfully. All files are the property of their respective owners.
The content on the website is provided AS IS for your information and personal use only. It may not be sold, licensed, or shared on other websites without obtaining consent from the author.
E N D
Presentation Transcript
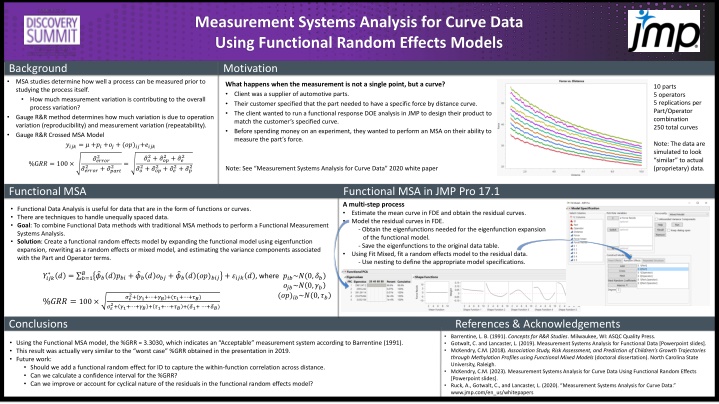
Measurement Systems Analysis for Curve Data Using Functional Random Effects Models Background Motivation MSA studies determine how well a process can be measured prior to studying the process itself. How much measurement variation is contributing to the overall process variation? Gauge R&R method determines how much variation is due to operation variation (reproducibility) and measurement variation (repeatability). Gauge R&R Crossed MSA Model ????= ? +??+??+ (??)??+???? What happens when the measurement is not a single point, but a curve? Client was a supplier of automotive parts. Their customer specified that the part needed to have a specific force by distance curve. The client wanted to run a functional response DOE analysis in JMP to design their product to match the customer s specified curve. Before spending money on an experiment, they wanted to perform an MSA on their ability to measure the part s force. 10 parts 5 operators 5 replications per Part/Operator combination 250 total curves Note: The data are simulated to look similar to actual (proprietary) data. 2+ ??? 2+ ??2+ ?? 2+ ??2 2 ?? 2+ ??? ?????? + ????? %G?? = 100 = 2 2 2 Note: See Measurement Systems Analysis for Curve Data 2020 white paper ?????? ?? Functional MSA Functional MSA in JMP Pro 17.1 A multi-step process Estimate the mean curve in FDE and obtain the residual curves. Model the residual curves in FDE. - Obtain the eigenfunctions needed for the eigenfunction expansion of the functional model. - Save the eigenfunctions to the original data table. Using Fit Mixed, fit a random effects model to the residual data. - Use nesting to define the appropriate model specifications. A screenshot of a computer Functional Data Analysis is useful for data that are in the form of functions or curves. There are techniques to handle unequally spaced data. Goal: To combine Functional Data methods with traditional MSA methods to perform a Functional Measurement Systems Analysis. Solution: Create a functional random effects model by expanding the functional model using eigenfunction expansion, rewriting as a random effects or mixed model, and estimating the variance components associated with the Part and Operator terms. cap Y sub i. j k to the asterisk operator , open paren d , close paren equals sum from b equals 1 to cap B of , open brace phi hat sub b , open paren d , close paren , p sub b i. plus phi hat sub b , open paren d , close paren , o sub b j plus phi hat sub b , open paren d , close paren , subscript base , open paren o p close paren , end base , sub b i. j , close brace plus end summation script epsilon sub i. j k , open paren d , close paren , where % cap G cap R cap R equals 100 times square root of , numerator , sigma sub script epsilon squared plus open paren gamma sub 1 plus dot dot dot plus gamma sub cap B close paren plus open paren tau sub 1 plus dot dot dot plus tau sub cap B close paren end numerator , over denominator , sigma sub script epsilon squared plus open second paren gamma sub 1 plus dot dot dot plus gamma sub cap B , , close second paren plus open second paren tau sub 1 plus dot dot dot plus tau sub cap B , , close second paren plus subscript base , open paren delta , end base , sub 1 plus dot dot dot plus delta sub cap B close paren end denominator , end square root Functional Data Analysis is useful for data that are in the form of functions or curves. There are techniques to handle unequally spaced data. Goal: To combine Functional Data methods with traditional MSA methods to perform a Functional Measurement Systems Analysis. Solution: Create a functional random effects model by expanding the functional model using eigenfunction expansion, rewriting as a random effects or mixed model, and estimating the variance components associated with the Part and Operator terms. Description automatically generated A screenshot of a computer ??? ???+ ??? ???+ ??? (??)??? +????? , where Description automatically generated ? ? = ?=1 ???? ???~? 0,?? ???~? 0,?? (??)??~? 0,?? 2+(?1+ +??)+(?1+ +??) 2+ ?1+ +??+ ?1+ +??+(?1+ +??) ?? %??? = 100 ?? Using the Functional MSA model, the %GRR = 3.3030, which indicates an Acceptable measurement system according to Barrentine (1991). This result was actually very similar to the worst case %GRR obtained in the presentation in 2019. Future work: Should we add a functional random effect for ID to capture the within-function correlation across distance. Can we calculate a confidence interval for the %GRR? Can we improve or account for cyclical nature of the residuals in the functional random effects model? Conclusions References & Acknowledgements Barrentine, L. B. (1991). Concepts for R&R Studies. Milwaukee, WI: ASQC Quality Press. Gotwalt, C. and Lancaster, L. (2019). Measurement Systems Analysis for Functional Data [Powerpoint slides]. McKendry, C.M. (2018). Association Study, Risk Assessment, and Prediction of Children s Growth Trajectories through Methylation Profiles using Functional Mixed Models (doctoral dissertation). North Carolina State University, Raleigh. McKendry, C.M. (2023). Measurement Systems Analysis for Curve Data Using Functional Random Effects [Powerpoint slides]. Ruck, A., Gotwalt, C., and Lancaster, L. (2020). Measurement Systems Analysis for Curve Data. www.jmp.com/en_us/whitepapers Using the Functional MSA model, the %GRR = 3.3030, which indicates an Acceptable measurement system according to Barrentine (1991). This result was actually very similar to the worst case %GRR obtained in the presentation in 2019. Future work: Should we add a functional random effect for ID to capture the within-function correlation across distance. Can we calculate a confidence interval for the %GRR? Can we improve or account for cyclical nature of the residuals in the functional random effects model?
Functional MSA Crossed Model Mixed Model Notation Variance Component and Gauge R&R Calculation Functional random effects model: For the MSA, there are now three sets of B variance components. B Part variance components ????? = ?? B Operator variance components ????????? = ??2? = (?1+ + ??) B Part/Operator variance components ????? ???????? = ??? 2 2? = (?1+ + ??) ????? = ? ? +?? ? + ??? + (??)??(?) + ????? ????? ? ? = ??? + ??? + ????? + ????? ? = ?=1 ??? ???+ ??? ???+ ??? (??)??? +????? 2 ? ???? 2 2? = (?1+ + ??) where ? = 1, ,N Parts ? = 1, ,? Operators ? = 1, ,? replications ? = 1, ,??? distance ? is the number of eigenfunctions Compute the Gauge R&R as ???~? 0,?? ???~? 0,?? (??)??~? 0,?? ??2+ (?1+ + ??) + (?1+ + ??) ??2+ ?1+ + ?? + ?1+ + ?? + (?1+ + ??) %??? = 100
Functional MSA in JMP Pro 17.1 Step 2: Choose a model to fit to the residual curves I used Direction Functional PCA (must use the Reduce option to put curves on a grid first). The Functional Principal Components Analysis (FPCA) provides the eigenfunctions needed to expand the functional model. Step 1: Estimate the mean curve and obtain residuals using a B-Spline model in FDE. Fit a functional random effects model on the residuals. Step 3: Save the eigenfunctions. The formula columns are formulas based on a Distance column. Copy the eigenfunction columns to the original data table.
Functional MSA in JMP Pro 17.1 Step 5: Fit the model to estimate the variance components. Step 4: Using the saved formula columns of the eigenfunctions and the Part and Operator variables, fit a random effects model to the residuals in Fit Mixed. Note that you can also specify fixed effects in this model to create a functional mixed model. ??2? + ??2? + ??? ??2(?) + ??2(?) + ??? 2(?) %??? = 100 2(?)= 3.3030 2(?) + ?? Step 6: Use the variance component estimates to calculate the %GRR.
Residuals from the Random Effects Model The residuals are relatively small and centered around zero and there are no crazy spikes or outliers. (that s GOOD) However, in all the models I fit, I still didn t love how the residuals looked across distance. Looking at the residuals this way is important, especially when working with functional data. We see some fanning of the residuals - they are larger for smaller values of distance and then they get narrower as distance increases. (this is not ideal) There is also a definite cyclical pattern in the residuals. (this is also not ideal)
