
Variance Analysis and Standard Costing in Business
Explore the concepts of standard costs, budgeted costs, and variance analysis in business. Understand the importance of investigating variances and learn to calculate and interpret different types of variances like material price, labor efficiency, and overhead volume variances.
5 views • 52 slides

Understanding the Concept of Return to Factor in Production Economics
Return to Factor is a key concept in production economics that explains the relationship between variable inputs like labor and total production output. The concept is based on the three stages of production - increasing returns, diminishing returns, and negative returns. By analyzing the behavior o
0 views • 7 slides
Discussion of Randomized Experiments and Experimental Design Challenges
Randomized experiments face statistical power challenges due to rare outcomes and high variance. Stratifying randomization can help control for correlated residual variance based on baseline values of outcomes. Implications for applied economists include addressing attrition and treatment effect het
0 views • 6 slides
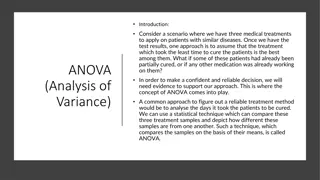
Understanding ANOVA: Analyzing Variance in Medical Treatments
Explore how ANOVA (Analysis of Variance) can help in comparing multiple medical treatments by analyzing the days taken for patients to be cured. ANOVA checks if means of different groups are significantly different, providing a reliable method to make informed treatment decisions. Learn the basics,
1 views • 10 slides

Comparing Logit and Probit Coefficients between Models
Richard Williams, with assistance from Cheng Wang, discusses the comparison of logit and probit coefficients in regression models. The essence of estimating models with continuous independent variables is explored, emphasizing the impact of adding explanatory variables on explained and residual vari
1 views • 43 slides

Understanding Real Estate Valuation and Market Value
Explore the concepts of real estate valuation, market value, and the methods used to determine the worth of properties. Learn about the importance of valuation in decision-making processes related to investments, financing, operations, and more. Understand how market value is derived based on probab
1 views • 62 slides

Statistical Analysis of Sugarcane Juice Weight Under 11 Pest Conditions
This study investigates the impact of various pest conditions on the weight of sugarcane juice through a 1-way ANOVA analysis. Experimental units consisted of grouped canes with different treatments including healthy control and various infestations. The analysis includes model diagnostics, populati
2 views • 18 slides
Understanding Analysis of Variance (ANOVA) for Testing Multiple Group Differences
Testing for differences among three or more groups can be effectively done using Analysis of Variance (ANOVA). By focusing on variance between means, ANOVA allows for comparison of multiple groups while avoiding issues of dependence and multiple comparisons. Sir Ronald Fisher's ANOVA method provides
0 views • 28 slides

Biometrical Techniques in Animal Breeding: Analysis of Variance in Completely Randomized Design
Biometrical techniques in animal breeding involve the use of analysis of variance (ANOVA) to partition total variance into different components attributable to various factors. In completely randomized designs, experimental units are randomly assigned to treatments, ensuring homogeneity. The total n
0 views • 34 slides
Analysis of Variance in Completely Randomized Design
This content covers the analysis of variance in a completely randomized design, focusing on comparing more than two groups with numeric responses. It explains the statistical methods used to compare groups in controlled experiments and observational studies. The content includes information on 1-way
0 views • 48 slides
Understanding Variance and Its Components in Population Studies
Variance and its components play a crucial role in analyzing the distribution of quantitative traits in populations. By measuring the degree of variation through statistical methods like Measures of Dispersion, researchers can gain insights into the scatterness of values around the mean. Partitionin
1 views • 22 slides
Understanding Standard Deviation, Variance, and Z-Scores
Explore the importance of variation in interpreting data distributions, learn how to calculate standard deviation, understand z-scores, and become familiar with Greek letters for mean and standard deviation. Discover the significance of standard deviation in statistical analysis and the difference b
1 views • 18 slides
Variance Estimation in Social Surveys: Using R for Complex Sampling
Explore the importance of social surveys in capturing key indicators like employment rates, spending, and wealth through a multistage sampling design. Learn about variance estimation in complex surveys, calibration techniques, and the linearised jackknife method for analyzing survey data. Discover t
1 views • 19 slides
Understanding Bias and Variance in Machine Learning Models
Explore the concepts of overfitting, underfitting, bias, and variance in machine learning through visualizations and explanations by Geoff Hulten. Learn how bias error and variance error impact model performance, with tips on finding the right balance for optimal results.
0 views • 22 slides

Understanding Measures of Variability: Variance and Standard Deviation
This lesson covers the concepts of variance and standard deviation as measures of variability in a data set. It explains how deviations from the mean are used to calculate variance, and how standard deviation, as the square root of variance, measures the average distance from the mean. Degree of fre
2 views • 26 slides
Understanding Multivariate Normal Distribution and Simulation in PROC SIMNORM
Explore the concepts of multivariate normal distribution, linear combinations, subsets, and variance-covariance in statistical analysis. Learn to simulate data using PROC SIMNORM and analyze variance-covariance from existing datasets to gain insights into multivariate distributions. Visualize data t
0 views • 16 slides
Understanding Marginal Costing in Cost Accounting
Marginal Costing is a cost analysis technique that helps management control costs and make informed decisions. It involves dividing total costs into fixed and variable components, with fixed costs remaining constant and variable costs changing per unit of output. In Marginal Costing, only variable c
1 views • 7 slides
Understanding Sources of Error in Machine Learning
This comprehensive overview covers key concepts in machine learning, such as sources of error, cross-validation, hyperparameter selection, generalization, bias-variance trade-off, and error components. By delving into the intricacies of bias, variance, underfitting, and overfitting, the material hel
0 views • 13 slides

Understanding Machine Learning Concepts: A Comprehensive Overview
Delve into the world of machine learning with insights on model regularization, generalization, goodness of fit, model complexity, bias-variance tradeoff, and more. Explore key concepts such as bias, variance, and model complexity to enhance your understanding of predictive ML models and their perfo
0 views • 32 slides

Understanding Analysis of Variance (ANOVA) in Animal Genetics & Breeding
ANOVA is a statistical method that partitions the total variance into components attributable to different factors in animal genetics and breeding. This lecture covers the concept of ANOVA, its types, application in Completely Randomized Design, calculations of Sum of Squares, and Mean Squares. It e
0 views • 36 slides

Ratio Method of Estimation in Statistics
The Ratio Method of Estimation in statistics involves using supplementary information related to the variable under study to improve the efficiency of estimators. This method uses a benchmark variable or auxiliary variable to create ratio estimators, which can provide more precise estimates of popul
0 views • 30 slides

An Overview of Evading Anomaly Detection using Variance Injection Attacks on PCA
This presentation discusses evading anomaly detection through variance injection attacks on Principal Component Analysis (PCA) in the context of security. It covers the background of machine learning and PCA, related work, motivation, main ideas, evaluation, conclusion, and future work. The content
1 views • 19 slides
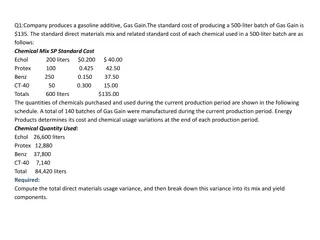
Costing and Variance Analysis in Manufacturing Processes
The content discusses various scenarios related to costing and variance analysis in manufacturing processes. It addresses topics such as direct materials usage variance, direct labor mix and yield variances, total direct labor efficiency variance, and standard costing system variances. The examples
0 views • 8 slides
Understanding Descriptive Statistics: Mean, Standard Deviation, and Variance
Explore the fundamentals of descriptive statistics focusing on mean, standard deviation, and variance. Dive into the importance of these measures in interpreting data patterns effectively, with practical examples like analyzing the average height of individuals and understanding central tendency met
1 views • 23 slides

Noida Power Company Limited True-up and ARR Summary for FY 2021-22
The document presents the true-up and annual revenue requirement (ARR) details for Noida Power Company Limited for the fiscal year 2021-22. It includes components of ARR, variance analysis, revenue surplus details, expenses breakdown, and other financial aspects. The report highlights deviations, re
0 views • 44 slides

Variance Case VA16-006 for Side Yard Setback Adjustment
The variance case VA16-006 pertains to varying the side yard setback from 8 feet to 5 feet for a first-floor addition on the main house and adjusting the setback for a detached garage. The lot is unusually shaped, narrow, and severely limited in buildable area due to setbacks. The proposed changes i
0 views • 8 slides

Load Following by Nuclear Power Plants in Relation to Variable Renewable Energies' Development
The study explores the requirements of load following by nuclear power plants in the context of variable renewable energies' growth. It discusses the impact of renewable energy development on nuclear economic models and the need for dispatchable capacities. Benchmarks are set to test robustness of d
0 views • 11 slides
Analysis of Variance in Women's Professional Bowling Association - 2009
This study conducted a 2-Way Mixed Analysis of Variance on the Women's Professional Bowling Association qualifying rounds in 2009 at Alan Park, Michigan. The analysis focused on factors including oil pattern variations and different bowlers, each rolling sets of games on different patterns to measur
0 views • 16 slides

Variance Estimation for Complex Survey Data and Microsimulation
Variance estimation is crucial for evidence-based policy-making. This workshop, held at the EUROMOD Winter School, focused on the importance of estimating precision in statistics. Key messages include reporting standard errors, confidence intervals, and p-values based on sample estimates, and emphas
0 views • 13 slides
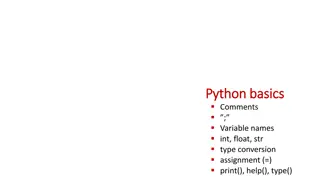
Python Basics: Comments, Variable Names, Assignments, and More
Learn about the basics of Python programming, including the use of comments to explain code, defining variable names, type conversion, assignment operators, and general guidelines for coding practices. Explore how to effectively use comments to describe code functionality and understand the signific
0 views • 21 slides
Variance Reduction Techniques in Monte Carlo Programs
Understanding variance reduction techniques in Monte Carlo simulations is essential for improving program efficiency. Techniques like biasing, absorption weighting, splitting, and forced collision help reduce variance and enhance simulation accuracy. By adjusting particle weights and distributions,
0 views • 37 slides

Statistical Genomics Lecture 5: Linear Algebra Homework Questions
Explore the concepts of random variables, covariance matrix, special matrices, and self-defined functions in statistical genomics through a series of homework questions. Gain insights into linear algebra and statistical genomics while working on Homework 1, analyzing the expectation and variance of
0 views • 22 slides
Hot Spot Motifs in Ig Heavy and Light Variable Region Sequences
B cells express unique receptors to combat pathogens, with membrane-bound immunoglobulins forming their diverse repertoire. The regions of high variance, known as CDRs, play a crucial role in antigen binding. Ig genes contribute significantly to immune function, with recent studies revealing genetic
0 views • 13 slides
Statistics: Understanding Variance and Standard Deviation
Understand the concepts of population variance, sample variance, and standard deviation. Learn how to calculate these measures for sample and grouped data, and their significance in analyzing data dispersion. Discover the differences between population and sample variance, and when to use each measu
0 views • 11 slides
Understanding Variance and Covariance in Probabilistic System Analysis
Variance and covariance play crucial roles in probabilistic system analysis. Variance measures the variability in a probability distribution, while covariance describes the relationship between two random variables. This lecture by Dr. Erwin Sitompul at President University delves into these concept
0 views • 30 slides
Understanding Discrete Random Variables and Variance Relationships
Explore the concepts of independence in random variables, shifting variances, and facts about variance in the context of discrete random variables. Learn about key relationships such as Var(X + Y) = Var(X) + Var(Y) and discover common patterns in the Discrete Random Variable Zoo. Embrace the goal of
0 views • 27 slides
Understanding One Factor Analysis of Variance (ANOVA)
One Factor Analysis of Variance (ANOVA) is a statistical method used to compare means of three or more groups. This method involves defining factors, measuring responses, examining assumptions, utilizing the F-distribution, and formulating hypothesis tests. ANOVA requires that populations are normal
0 views • 23 slides

Approaches to Variance Estimation in Social Policy Research
This lecture discusses approaches to estimating sampling variance and confidence intervals in social policy research, covering topics such as total survey error, determinants of sampling variance, analytical approaches, replication-based approaches, and the ultimate cluster method. Various methods a
1 views • 34 slides
Understanding Bias and Variance in Machine Learning
Exploring the concepts of bias and variance in machine learning through informative visuals and explanations. Discover how model space, restricting models, and the impact of bias and variance affect the performance of machine learning algorithms. Formalize bias and variance using mean squared error
0 views • 21 slides

Teaching Budgets and Variance Analysis in Business Qualifications
Explore resources and activities like "this.webinar.20.mins" and "Dont Tell the Bride" that introduce the concepts of budgets and variance analysis in business education. Engage in activities like "Calculate the total profit variance" to practice analyzing budgeted versus actual profits. Find more r
0 views • 10 slides