Statistics: Understanding Variance and Standard Deviation
Understand the concepts of population variance, sample variance, and standard deviation. Learn how to calculate these measures for sample and grouped data, and their significance in analyzing data dispersion. Discover the differences between population and sample variance, and when to use each measure.
Download Presentation

Please find below an Image/Link to download the presentation.
The content on the website is provided AS IS for your information and personal use only. It may not be sold, licensed, or shared on other websites without obtaining consent from the author.If you encounter any issues during the download, it is possible that the publisher has removed the file from their server.
You are allowed to download the files provided on this website for personal or commercial use, subject to the condition that they are used lawfully. All files are the property of their respective owners.
The content on the website is provided AS IS for your information and personal use only. It may not be sold, licensed, or shared on other websites without obtaining consent from the author.
E N D
Presentation Transcript
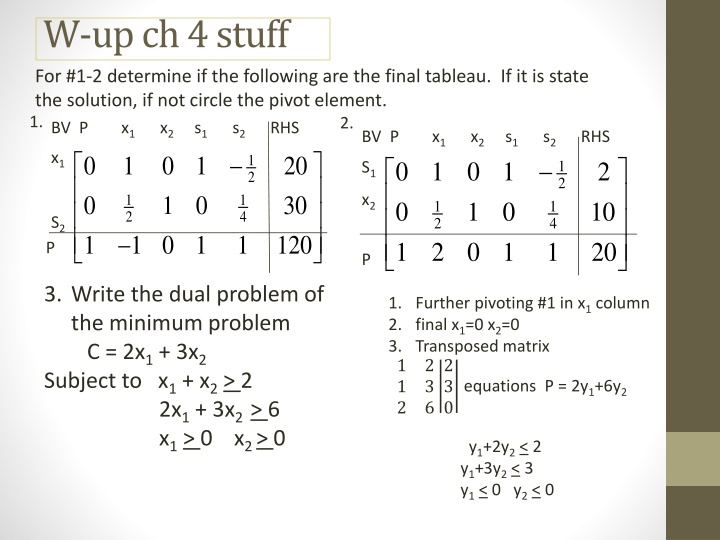
W-up ch4 stuff For #1-2 determine if the following are the final tableau. If it is state the solution, if not circle the pivot element. BV P x1 x2 s1 s2 RHS 1. 2. BV P x1 x2 s1 s2 RHS x1 0 0 1 1 0 1 1 0 20 30 120 1 2 0 1 0 1 0 1 2 1 2 S1 1 2 1 4 1 x2 1 0 10 20 1 2 2 0 1 1 4 1 S2 1 0 1 P P 3. Write the dual problem of the minimum problem C = 2x1 + 3x2 Subject to x1 + x2 > 2 2x1 + 3x2 > 6 x1 > 0 x2 > 0 1. Further pivoting #1 in x1 column 2. final x1=0 x2=0 3. Transposed matrix 1 2 1 3 2 6 0 2 3 equations P = 2y1+6y2 y1+2y2 < 2 y1+3y2 < 3 y1 < 0 y2 < 0
9.5 Measure of Dispersion Find the standard deviation for sample data Find standard deviation for grouped data The extent to which scores are spread out Range: difference between largest and smallest value Variance a measure of deviation from the mean Two types Population Variance and Sample Variance
Population Variance ?2=(?1 ?)2+ (?2 ?)2+ + (?? ?)2 ? Where ? =?1+?2+?3+ +?? and N is the number of items in the population is the population mean ? Sample Variance ?2=(?1 ?)2+(?2 ?)2+ +(?? ?)2 Where ? =?1+?2+?3+ +?? n is the number of items in the population ? 1 is the sample mean and ? How are they alike? How are they different? When do you use which one?
Ex1: calculate sample variance for the set S: 4, 6, 8, 10, 12, 14, 16 Find ? =4+6+8+10+12+14+16 = 10 7 n = 7 (7 items in the set) Plug into formula ?2=(4 10)2+(6 10)2+(8 10)2+(10 10)2+(12 10)2+(14 10)2+(16 10)2 7 1 S2 = 18.67 Note the variance is SQUARED when we take the square root, we have found the STANDARD DEVIATION If S2 = 18.67 then = 18.67 = 4.32
Standard Deviation of SAMPLE DATA (?1 ?)2+(?2 ?)2+ +(?? ?)2 ? 1 x1, x2 xn if n data items are taken from the population ? is the sample mean (?? ?)2 ? 1 ? = = In general, A relatively small standard deviation indicates that the measures tend to cluster close to the mean. A relatively large standard deviation shows the measures are widely scattered from the mean.
Standard Deviation for GROUPED DATA (?? ?)? ??+(?? ?)? ??+ +(?? ?)? ?? ? ? m1, m2 mn are the class midpoints f1, f2, fn are the respective frequencies N is the number of data items N = f1 + f2+ +fk (?? ?)? ?? ? ? ? = =
Ex 2: given the set of data , find the standard deviation ?? ?? ?? ?? ? (?? ?)? (?? ?)? ?? Class interval freq 0 3 2 1.5 5.5 9.5 13.5 17.5 3 27.5 76 81 52.5 240 -8.5 -4.5 -0.5 3.5 7.5 72.25 20.25 0.25 12.25 56.25 144.5 101.25 2 73.5 168.75 490 4 7 5 8 11 8 12 15 6 16 19 3 Sum (total) 24 Find ? = ???? =240 24= 10 ? (?? ?)? ?? ? ? 490 24 1= ?.?? Find S = =
Standard Deviation on Calculator Enter data in list 1 After data is entered Lets review ? is mean ? is sum of all data ?2 is something you use in later stat classes Sx is sample standard deviation ?? is population standard deviation n is the number of data points STAT EDIT STAT CALC 1-VAR STATS
Ex 3: use you calc to answer following questions At the end of the 2003 spring training, the ages of the 34 men on the 2002 World Series champion Anaheim Angel roster are A) find range B) find standard deviation assuming sample data C) find standard deviation assuming population data D)Decide whether the data is sample or population. Give reason 35, 27, 32, 22, 24, 30, 33, 30, 33, 21, 29, 22, 27, 28, 33, 28, 33, 30, 29, 25, 30, 25, 27, 25, 30, 26, 27, 30, 30, 29, 28, 32, 34, 28 14 3.517 3.465
Using your calc to find standard deviation for grouped data Put MIDPOINTS of each class interval in L1 Put FREQUENCY of each class interval in L2 Go to You get L1, L2, etc by pushing TA-DA there is your standard deviation Lets try with data from EX 2 of our notes STAT CALC 1-VAR STATS L1, L2 2nd 1 or 2 etc
homework 3, 5, 7 BY HAND show work 11,13 USE CALC
