Understanding Real Estate Valuation and Market Value
Explore the concepts of real estate valuation, market value, and the methods used to determine the worth of properties. Learn about the importance of valuation in decision-making processes related to investments, financing, operations, and more. Understand how market value is derived based on probability distributions and variance calculations, ensuring a reliable estimate. Dive into an example illustrating the calculation of expected market value and the associated variance.
Download Presentation

Please find below an Image/Link to download the presentation.
The content on the website is provided AS IS for your information and personal use only. It may not be sold, licensed, or shared on other websites without obtaining consent from the author. Download presentation by click this link. If you encounter any issues during the download, it is possible that the publisher has removed the file from their server.
E N D
Presentation Transcript
REAL ESTATE 410 Valuation Income Properties Spring 2017 1
Topics Concept of value Sales comparison approach Cost approach Income approach Meaning of capitalization (cap) rate Valuation case study 2
Introduction Purpose of valuation? Estimate market value Why valuation? Market value not directly observable for most real estate Reasons for valuation? Financing, sale, refinancing, etc. Who perform valuations? Appraisers 3
What is Market Value? Generally, the market value of a property refers to anestimate of the property s worth under normal or typical conditions. Valuation is the primary consideration before any other questions can be raised. Knowing what a real estate asset is worth is necessary before making any other decision related to the land and/or buildings. Investment decision Financing decision Operating decision Disposal Redevelopment 4
What is Market Value? Do you know exactly how much your property is going to sell for? No, there is a probability distribution of possible prices. In theory, the market value of a property depends then on the probability distribution of possible prices. It is the expected value derived from the set of possible prices and their attached probability of occurrence. There is some uncertainty attached to the valuation. The wider (tighter) the distribution of possible price, the less (more) reliable the value estimate. The reliability of the estimate is measured by the variance of the distribution or standard deviation, which is the squared root of the variance. 5
What is Market Value? Assuming a discrete set a n possible prices, Pi, and attached probabilities wi adding to 1. Then the expected market value is: ? ?(?) = ???? ?=1 Reliability (uncertainty) of estimate: variance. ? ?? [?? ?(?)]2 ??? ? = ?=1 The standard deviation is the square root of variance 6
Example Pi wi wi.Pi Pi-E(P) wi[Pi-E(P)]^2 $150,000 10% $15,000 -$21,000 44,100,000 $160,000 20% $32,000 -$11,000 24,200,000 $170,000 30% $51,000 -$1,000 300,000 $180,000 30% $54,000 $9,000 24,300,000 $190,000 10% $19,000 $19,000 36,100,000 Total Prob. 100% E(P) $171,000 Variance 129,000,000 Std. Dev. $11,358 7
What is Market Value? Market value refers to how much a property is worth to the marginal investor group. Market value is not defined with respect to a specific buyer and therefore does not consider any potential buyer s personal circumstances. Market value is based on expected future before-tax cash flows (i.e., NOI). Remember, NOIs are property level cash flows, the earnings that will be split between the equity owner (i.e., the buyer of the property) and the providers of the remaining financing. The (market) value of real estate is generally derived through appraisal. 8
What is Investment Value? Investment value refers to how much a property is worth to someone as an investor more to come later. Investment value is defined with respect to a specific owner, given his specific characteristics. Investment value is derived for a specific holding of the asset and integrates the investor s competitive advantage in owning and operating the asset. Unlike market value, investment value is based on expected future net after-tax cash flows from the asset to that particular investor. 9
Market vs. Investment Values Market value How much the property is likely sell for today. The value it is likely to fetch if put in highest and best use. Market value is generally not investor specific. Investment value What the property is worth to you as an investor, if you re not going to sell it for a long time. Investment value is always investor specific. The appraisal process is meant to estimate market value, not investment value. 10
Appraisal Process The appraisal process is performed by appraisers and others seeking to estimate market value. 1. Physical and legal identification 2. Identify property rights to be valued 3. Specify the purpose of the appraisal 4. Specify effective date of value estimate 5. Gather and analyze market data 6. Apply techniques to estimate value 11
Appraisal Process The three approaches: Cost Approach Sales Comparison Approach Income Approach At least two of the three methods are used when valuing income properties. We will focus on the income approach, but the other two have substantial validity also. 12
Cost Approach The rationale is that informed buyers would not pay more for a property than the cost to build a new one. This assumes, of course, that they took the time to construct a new asset into account, and the relative risks of ground up development. Valuation Process: 1. Estimate the construction (reproduction) cost if new 2. Account for physical deterioration, functional obsolescence, and/or external obsolescence 3. Add land cost 13
Cost Approach The cost method generally generates the highest value estimate relative to other valuation methods. Remember, new construction will only take place if current market rent is at or above replacement cost rent. The cost approach is often used for real estate assets that do not have an efficient market for tenants to lease space. Examples: Heavy automobile manufacturing facilities, stadiums, churches, 14
Sales Comparison The rationale for this method is that an investor will never pay more than investors recently paid for similar properties. Valuation Process: 1. Use data from recently sold comparable properties to derive subject property s market value. 2. Adjust comparable sales prices for feature, age, and size differences, etc. 3. Adjust the value of each comparable. 4. Derive a value for the subject property. 15
Sales Comparison The sales comparison approach is a generally more subjective process compared to cost approach and income methods. The accuracy depends on the availability of true comparables in terms of both property characteristics and timing of sale. The objective should be to minimize adjustments. The more adjustments made the less accurate the value estimate! 16
Sales Comparison Sales comparison method indirectly derives a property value by estimating the value of its various components. This can be achieved more accurately by estimating a hedonic price modelusing regression analysis. This method allows to extract the prices of the various property attributes (e.g., room, bathroom, garage) and then applying these prices to the quantities of the subject property to estimate its value. This requires having a large sample of relevant properties transactions. The more attributes to estimate the large the sample required 17
Income Approach The income approach estimates a property s value by capitalizing (assigning a value today) future income stream from the property. Rationale Valuing an income producing property is similar to valuing the income (cash flows) it is expected to generate throughout its economic life. Thus the value of a property is the value today (or the present value) of the future income stream using a discount rate that reflects the risk associated with the cash flow. 18
Income Approach There are three methods for the income approach. Gross Income Multipliers ( GIM ) Direct Capitalization (Cap Rate) Method Discount Cash Flow (Present Value) Method 19
GIM Method 1. Identify comparable properties that recently sold 2. Extract the gross income multipliers of these comparable transactions as ????? ????? ????? ?????? ??? = 3. Estimate the GIM of the subject property. This is not an averaging exercise! 4. Apply the to come up with an estimate of value. GIM to subject property s income Method can be based on PGI or EGI (be mindful of the imply assumption about vacancy and don t forget expense recoveries!) 20
GIM Method Subject Property Comp. 1 Comp. 2 Comp. 3 Sales Price ? $600,000 $750,000 $450,000 PGI $120,000 $100,000 $128,000 $74,000 GIM ? 6x 5.86x 6.08x Which one is most similar to the subject property and what weighting should we to come up with a GIM? Assuming 6x is determined to be the appropriate GIM Value Estimate = 6 x $120,000 = $720,000 21
GIM Method The intuition behind this method is not very clear since it use revenue rather than cash flow generated by the subject property. But it is easy to implement because no estimate of operating expenses is required. May lead to inaccurate value estimates because: GIMs are not widely published There is no guarantee that comparables used to estimate the GIM have similar operating expenses The direct capitalization and discounted cash flow methods produce more accurate estimates. 22
Direct Capitalization Method The method is commonly referred to as the cap rate method (most used by practitioners). It estimates value by dividing next year s NOI by the prevailing capitalization rate (cap rate). ??????=????+1 ?? The applicable cap rate (R) is extracted from recent transactions of comparable properties. This method requires more information about income than the GIM method. 23
Direct Capitalization Method Example: Want a value a property expected to generate NOI of $58,000 next year. Recent similar property sales: Comp. 1 $368,500 $50,000 13.57% Comp. 2 $425,000 $56,100 13.20% Comp. 3 $310,000 $42,700 13.77% Comp. 4 $500,000 $68,600 13.72% Sales Price NOI R Cap rate range: 13.20% < R < 13.77% The choice of which cap rate to use is an educated opinion of the appraiser. Which property is most similar to the subject? 24
Direct Capitalization Method Based on these comparable, the estimated value of the subject property could be: $58,000 0.1377< ????? <$58,000 or $421,205 < ????? < $439,394 0.1320 The final value estimate is left to the good judgment of the appraiser. Utmost care must be taken when determining R, i.e., when choosing comparables. 25
Dangers of Direct Capitalization Direct capitalization methods can be misleading for market value if subject property does not have cash flow growth and risk patterns typical of comparable properties from which cap rate was obtained. With GIM, it is even more dangerous because operating expenses must also be typical! Cap rate is most appropriate for buildings with short-term leases in less cyclical markets, like apartments. Market-based ratio valuation won t protect you from bubbles ! 26
Determining Cap Rates Consider the comparables: Similarity to subject property Physical attributes, location, lease terms, operating efficiency How is NOI determined? Stabilized NOI Adjust for nonrecurring capital outlays Was NOI skewed by a one-time outlay? Depending on the analyst, leasing commissions, tenant improvements, and recurring capital outlays may or may not be included in the calculation of NOI, but appropriate cap rate must be used then. 27
Cap Rate and Cost of Capital Also cap rate can be thought of as a return on and capital, all capital used to buy the property. Return on capital is the price for providing the capital (both equity and debt) to buy the property. The higher investors required returns, the higher cap rates and the lower property valuations. Also, the lower required rates of return on capital (e.g., long-term interest rates), the lower cap rates and the higher property values. 28
Cap Rate and Cost of Capital NOI is the income share by providers of capital (equity owner and debtholders). Therefore, cap rate can also be thought of as weighted average cost of capital (WACC). WACC weights costs of equity and debt as follows: When recent comparable property sales are not available, then the WACC approach can be relied upon to estimate cap rates for valuation purposes. 29
Cap Rate and Cost of Capital The cap rate calculation does not consider rental growth. Remember, cap rate is next year s NOI divided by property value, it does not directly factor in rental growth. Intuitively, properties with higher rental growth rates (and faster price appreciation) should fetch lower cap rates (higher prices). We will see later the relationbetween cap rate, required return, and rental income growth. 30
Market Conditions and Cap Rates Market conditions affect both property values, appreciation rates, and income risk. A market becoming over supplied (overbuilt) will increase the uncertainty of income which implies higher risk and also reduce rental growth rates, causing higher cap rates. If the market demand is getting stronger with little possibility of new supply, we will see faster rental growth and lower cap rates. 31
Property Age and Cap Rates Older properties tend to have more uncertain repairs and capital improvement expenditures, and tend to be located in lower appreciation areas. Both these factors cause higher cap rates. As a result, going-out cap rates (disposals) tend to be higher than going-in cap rates (acquisitions), everything else the same. More to come! 32
Summary of Influences on Cap Rates Valuation Factor Growth in income Impact on Cap Rate Faster growth means a low cap rate and higher value Higher risk means a higher cap rate and lower value Shorter economic life means a higher cap rate and lower value Higher interest rates imply higher cap rates and lower value Stronger rental market imply lower cap rates and higher values Older properties typically have more risk as a result of greater repair volatility. More risk means higher cap rates and lower values Risk Economic obsolescence Interest rates or cost of capital Market conditions Property age 33
Cap Rate Spreads Normally, there are two cap rates: Going-in cap rates for property buyers. Going-out cap rates for property sellers. Going-in cap rates is normally lower than the going out cap rates. Why? The difference between the going-out cap rate and the going-in cap rate is referred to as the cap rate spread. It is like the bid-ask spread for bonds. Cap rate spreads shrink during hot markets, with the opposite being true in cold markets. Cap rate spreads reflect market liquidity (i.e., ease to find a party to a transaction). 34
Discounted Cash Flow Method The discounted cash flow (DCF) method estimates market value of an income-producing asset as the discounted value of expected cash flows. Cash flows are projected for entire holding period (or life of the asset if the investor has no plan to sell the asset in the future). The valuation is based on before-tax cash flows using projected net operating incomes (NOIs). If the investor is planning to sell the asset at some point in the future, a resale value must be estimated. The appropriate discount rate is the return required by investors for cash flow of similar risk. 35
DCF Method What are the inputs required to compute the present value of a property s cash flows? Choose the holding period Forecast NOIs throughout the holding period Determine the reversion value of property Select an appropriate discount rate (r) based on risk and return of comparable investments (i.e., market conditions) 36
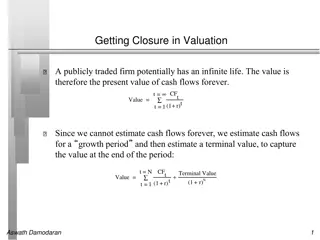
DCF Method The market value of the subject property today (MV0) is therefore the sum of discounted future NOIs from the property and the net selling price (NSP) at the end of the investment horizon assumed to last T periods. Again, the calculation should use an appropriate discount rate (r), also referred to as the required rate of return or yield. = + + + NOI 1 r + NOI (1 r ) + NOI (1 r ) + NSP (1 r ) + MV 1 2 T T 0 2 T T T t 1 = = + NOI (1 r ) + NSP (1 r ) + MV t T 0 t T 37
DCF Method If the investor is not planning to sell the property (infinite holding period), then we have an infinite series of NOIs and NSP is zero. The valuation formula then becomes: = = NOI (1 r ) + + MV t 0 t t 1 = = If NOI is also assumed constant over time (no income growth), then the valuation formula collapses to: MV = = NOI 1 0 r This formula is similar to that of the cap rate method. The cap rate method is therefore intuitively sound as long as the underlying assumptions are correct. 38
DCF Method Assuming the cash flows are perpetually growing at a constant rate of g per year and assuming a discount rate of r, withg < r, then the valuation formula is: = = NOI r MV 1 0 g This formula gives a more general interpretation of property cap rates (R) as: R = r - g Cap rates are approximately equal to required rate of return less real income (rent) growth rate. 39
DCF Reversion Cash Flow But we still need to estimate the cash flow from the disposal of the property (i.e., NSP), unless we assume that the property will not be sold. Remember, T t 1 = = + NOI (1 r ) + NSP (1 r ) + MV t T 0 t T The final year cash flow at the end of period T is composed of that year s NOI and the net sale price. 40
DCF Reversion Cash Flow NSP is the expected sale price at the disposal of the property at the end of period T (SP) less any selling expenses (e.g., fees and commissions) The easiest way to compute the expected sale price (SPT) is to apply the cap rate method to NOI at the end of period T+1 as follows. SPT = NOIT+1 / R But the relevant cap rate here is the expected going-out cap rate at the end of year T. The challenge is to estimate going-out cap rate. 41
DCF Example 1 The subject property is an office building with a single lease. The asking price is $13,453,000. Suppose the present time is the end of the year 2002. The building has a 6-year "net lease" which provides the owner with $1,000,000 at the end of each year for the next three years (2003, 2004, 2005). After that, the rent "steps up to $1,500,000 for the following three years (2006 through 2008), according to the lease. At the end of the sixth year (2008) the property can be expected to be sold for 10 times that year s rent. Thus, the investment is expected to yield $1,000,000 in each of its first three years, $1,500,000 in each of the next two years, and finally $16,500,000 in the sixth year (consisting of the $1,500,000 rental payment plus the $15,000,000 "reversion" or sale proceeds). 42
DCF Example 1 Asking investors in the market what they target for yields, you figure that 10% per year would be a reasonable expected average required rate of return for an investment in this property. Then the value of the property is found by applying the DCF formula as follows: 3 1,000,000 1.10? 5 1,500,000 1.10? +16,500,000 1.105 $13,757,000 = + ?=1 ?=4 If the price were less than this, say, $12 million, the buyer would see an expected return greater than 10%. 43
DCF Example 2 An investor is looking to purchase a property consisting of 8 apartments, renting currently for $2,000 per month each. Rent expected to grow at 2% for the foreseeable future. Assume vacancy rate at 5%, operating expenses at 40% of EGI and capital expenditure allowance at 5% of EGI. 1. If the required rate of return is 8% and the current going-in cap rate is 7%, what is the value of this property using income capitalization rate and the discounted cash flow methods? 2. Assuming and investment horizon is 3 years and NSP of property is $1,700,000 at the end of the 3rd year, what is the expected going-out rate? 44
DCF Example 2 NOIs Year 0 Year 1 Year 2 Year 3 192,000 195,840 199,757 203,752 PGI (9,792) (9,988) (10,188) VC 186,048 189,769 193,564 EGI (74,419) (75,908) (77,426) OE (9,302) (9,488) (9,678) CAPEX 102,327 104,373 106,460 NOI 45
DCF Example 2 1. Valuation using the DCM: MV0 = NOI1/(Cap Rate) = 102,327/.07 = $1,461,814 2. Valuation using the DCF Method: Year 0 Year 1 102,327 Year 2 104,373 Year 3 106,460 1,700,000 1,806,460 NOI NSP Total CF 102,327 104,373 PV of CF 94,747 89,483 1,434,026 MV0 = sum PVs = $1,618,256 3. What is the expected going-out cap rate at the end of year 3? 46
DCF Example 3 A property has a projected year 1 NOI of $200,000. NOI is projected to grow by 4% per year for the following 2 years, then by 2% per year for the subsequent 2 years at a 1% constant rate afterward. Given a constant required return of 13% for the foreseeable future (a gross approximation!), what is the value of the property? 47
DCF Example 3 Solution NOI1 = $200,000 NOI2 = $208,000 NOI3 = $216,320 NOI4 = $220,646 NOI5 = $225,059 Constant 1% growth begins ???????? ????? =???6 $227,310 0.13 0.10= $1,894,250 ? ?= 48
DCF Example 3 Solution CF0 = 0 CF1 = $200,000 CF2 = $208,000 CF3 = $216,320 CF4 = $220,646 CF5 = $225,059 + $1,894,250 i = 13% PV = $1,775,409 49
DCF as Appraisal Method DCF can easily reflect any unusual variations in the rental and expense flows of the subject property. DCF procedure differs from simpler valuation approaches in that it technically makes explicit the long-term period by period return estimates. Use of DCF does not preclude or supersede the application of insight and intuition. The valuation estimate should make sense and it is important to check its sensitivity to various assumptions built in the model. 50


