Understanding Discrete Random Variables and Variance Relationships
Explore the concepts of independence in random variables, shifting variances, and facts about variance in the context of discrete random variables. Learn about key relationships such as Var(X + Y) = Var(X) + Var(Y) and discover common patterns in the Discrete Random Variable Zoo. Embrace the goal of mastering distributions and probability calculations without the need to memorize every detail.
Download Presentation

Please find below an Image/Link to download the presentation.
The content on the website is provided AS IS for your information and personal use only. It may not be sold, licensed, or shared on other websites without obtaining consent from the author. Download presentation by click this link. If you encounter any issues during the download, it is possible that the publisher has removed the file from their server.
E N D
Presentation Transcript
Discrete RV Zoo CSE 312 Spring 21 Lecture 14
What Does Independence Give Us? If ? and ? are independent random variables, then Var ? + ? = Var ? + Var(?) ? ? ? = ? ? ? ? ? ?= ? ? ? 1 ? ?
Shifting the variance We know that ? ?? + ? = ?? ? + ?. What happens with variance? i.e., what is Var(?? + ?)? Pause and guess: what is Var(? + ?)? What is Var(??)?
Facts About Variance Var ? + ? = Var(?) Proof: Var ? + ? = ? ? + ?2 ? ? + ?2 = ? ?2+ ? 2?? + ? ?2 ? ? + ?2 = ? ?2+ 2?? ? + ?2 ? ?2 2?? ? ?2 = ? ?2 ? ?2 = Var(?)
Facts About Variance Var ?? = ?2Var(?) = ? ??2 (? ?? )2 = ?2? ?2 ?? ? = ?2? ?2 ?2? ?2 = ?2? ?2 ? ?2 2
Shifting a random variable For any random variable For any random variable ?, and any constants ? ?? + ? = ?? ? + ? and any constants ?,?: : For any random variable For any random variable ?, and any constants ??? ?? + ? = ?????(?) and any constants ?,?: :
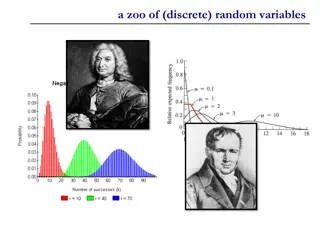
Discrete Random Variable Zoo There are common patterns Flip a [fair/unfair] coin [blah] times and count the number of heads. Flip a [fair/unfair] coin until the first time that you see a heads Draw a uniformly random element from [set] patterns of experiments: Instead of calculating the pmf, cdf, support, expectation, variance, every time, why not calculate it once once and look it up every time?
Whats our goal? Your goal is NOT to memorize these facts (it ll be convenient to memorize some of them, but don t waste time making flash cards). Everything is on Wikipedia anyway. I check Wikipedia when I forget these. Our goals are: 0. Introduce one new distribution we haven t seen at all. 1. Practice expectation, variance, etc. for ones we have gotten hints of. 2. Review the first half of the course with some probability calculations.
Zoo! ?~???(?) ?~????(?,?) ?~???(?,?) ?~???(?) ? ? ? ??? = ? ?? ?? ? ? =? ? ??? ? =? ? ??? ?? ? ??? = ??? = ? ?; ??(?) = ? ??? = ? ? =? + ? ? ? + ? ? ? = ? ? ? = ?? ? ? ? ? ? + ? ?? ?? ??? ? = ??? ? = ?(? ?) ??? ? = ??(? ?) ?~???(?) ?~??????(?,?,?) ?~??????(?,?) ??? =??? ? ? ? ? ? ? ? =? ? ? ? ? ? ? ? ? ??? ?? ? ??? = ??? = ?! ? ? = ?? ? ? = ? ? ? ??? ? =?(? ?) ??? ? =?(? ?)(? ?) ??(? ?) ??? ? = ? ??
The Poisson Distribution A new kind of random variable. We use a Poisson distribution when: We re trying to count the number of times something happens in some interval of time. We know the average number that happen (i.e. the expectation) Each occurrence is independent of the others. There are a VERY large number of potential sources for those events, few of which happen.
The Poisson Distribution Classic applications: How many traffic accidents occur in Seattle in a day How many major earthquakes occur in a year (not including aftershocks) How many customers visit a bakery in an hour. Why not just use counting coin flips? What are the flips the number of cars? Every person who might visit the bakery? There are way too many of these to count exactly or think about dependency between. But a Poisson might accurately model what s happening.
Its a model By modeling choice, we mean that we re choosing math that we think represents the real world as best as possible Is every traffic accident really independent? Not really, one causes congestion, which causes angrier drivers. Or both might be caused by bad weather/more cars on the road. But we assume they are (because the dependence is so weak that the model is useful).
Poisson Distribution ?~Poi(?) Let ? be the average number of incidents in a time interval. ? is the number of incidents seen in a particular interval. Support ??? =??? ? ?! (for ? ) ? ?? ??? = ? ? ?=0 ?! ? ? = ? Var ? = ?
Some Sample PMFs PMF for Poisson with lambda=1 PMF for Poisson with lambda=5 0.4 0.4 0.35 0.35 0.3 0.3 0.25 0.25 0.2 0.2 0.15 0.15 0.1 0.1 0.05 0.05 0 0 0 5 10 0 5 10
Lets take a closer look at that pmf ??? =??? ? ?! (for ? ) If this is a real PMF, it should sum to 1. Let s check that to understand the PMF a little better. ??? ? ?! ?=0 Taylor Series for ?? ?? ?!= ?? ?? ?! = ? ? ?=0 = ? ???= ?0= 1 ?=0
Lets check somethingthe expectation ? ? ??? ? ? = ?=0 ?! ? ? ??? ?! first term is 0. ?? (? 1)! cancel the ?. ? ??? 1 = ?=1 ? ? = ?=1 (? 1)! factor out ?. ? ??? = ? ?=1 (?)! Define ? = ? 1 = ? ?=0 = ? 1 The summation is just the pmf!
Where did this expression come from? For the cars we said it s like every car in Seattle independently might cause an accident. If we knew the exact number of cars, and they all had identical probabilities of causing an accident It d be just like counting the number of heads in ? flips of a bunch of coins (the coins are just VERY biased). The Poisson is a certain limit as ? but ?? (the expected number of accidents) stays constant.
Situation: Bernoulli You flip a biased coin (once) and want to record whether its heads. You define an indicator random variable, and want to know whether it s 1 or not. More generally: you have one trial, and some probability ?of success.
Bernoulli Distribution ?~Ber(?) Parameter ? is probability of success. ? is the indicator random variable that the trial was a success. ??0 = 1 ?,??1 = ? 0 if ? < 0 1 ? if 0 ? < 1 1 if ? 1 ??? = Some other uses: Some other uses: Did a particular bit get written correctly on the device? Did you guess right on a multiple choice test? Did a server in a cluster fail? ? ? = ? Var ? = ?(1 ?)
Situation: Binomial You flip a coin ? times independently, each with a probability ? of coming up heads. How many heads are there? More generally: How many success did you see in ? independent trials, where each trial has probability ? of success?
Binomial Distribution ?~Bin(?,?) ? is the number of independent trials. ? is the probability of success for one trial. ? is the number of successes across the ? trials. ???1 ?? ? for ? {0,1, ,?} ?? is ugly. ? ? = ?? Some other uses: Some other uses: How many bits were written correctly on the device? How many questions did you guess right on a multiple choice test? How many servers in a cluster failed? How many keys went to one bucket in a hash table? ? ??? = Var ? = ??(1 ?)
Situation: Geometric You flip a coin (which comes up heads with probability ?) until you get a heads. How many flips did you need? More generally: how many independent trials are needed until the first success?
Geometric Distribution ?~Geo(?) ? is the probability of success for one trial. ? is the number of trials needed to see the first success. ??? = 1 ?? 1? for ? {1,2,3, } ??? = 1 1 ??for ? ? ? =1 p Var ? =1 ? ?2 Some other uses: Some other uses: How many bits can we write before one is incorrect? How many questions do you have to answer until you get one right? How many times can you run an experiment until it fails for the first time?
Geometric: Expectation ? 1 ?? 1? ? ? = ?=1 1 1 ?. ? 1 ?? 1= ? = ? ?=1 ?2= Var ? = ? ?2 ? ? 2 ? ?2= ?=1 ?21 ?? 1? = ? ?=1 ?21 ?? 1
Geometric Property Geometric random variables are called memoryless Suppose you re flipping coins (independently) until you see a heads. The first three came up tails. How many flips are left left until you see the first heads? It s another independent copy of the original! The coin forgot it already came up tails 3 times.
Formally Let ? be the number of flips needed, ? be the flips after the third. ? = ? ? 3) = (? = ? ? 3)/ (? 3) 1 ??+3 1? 1 ?3 = 1 ?? 1? Which is ??(?).
