
Scenarios 2024 Modelling Methodologies
Explore the cutting-edge methodologies and tools implemented in the TYNDP 2024 Scenarios to enhance energy system representation and sector integration. Innovations include hydrogen modeling, heat and EV modeling improvements, offshore wind hubs, and deviation scenarios to meet EU targets.
1 views • 41 slides

95% Confidence Intervals in Statistics
Confidence intervals are a key concept in statistics that provide a range within which the true value of an estimate is likely to fall. This video series explores the interpretation of 95% CIs, compares them to standard error and standard deviation, and explains how sample size and standard deviatio
3 views • 8 slides

Medical Center Health System.
The Medical Center Health System (MCHS) emphasizes the importance of reporting patient safety events to improve the quality and safety of patient care. All team members are encouraged to report any deviation from routine care, events causing harm or potential harm, near misses, patient complaints, a
0 views • 4 slides
Prism Terminology and Light Deviation
Prisms are optical devices that deviate light without changing its vergence. This module explores the various terminology associated with prisms, including Apex, Base, Refracting Angle, and Angle of Deviation. The passage of light through a prism follows Snell's Law, where the ray is deviated toward
5 views • 42 slides
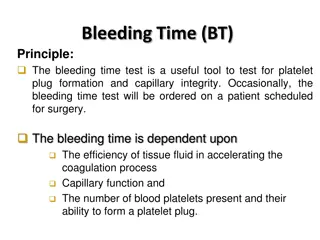
Bleeding Time and Coagulation Time Tests
The Bleeding Time (BT) test evaluates platelet plug formation and capillary integrity, crucial for surgery preparations. Prolonged bleeding times indicate low platelet count or dysfunction. The Duke method is one way to determine Bleeding Time. Sources of error, such as medication interference, impr
7 views • 8 slides

Spring 2BL : Lecture 5
In Lecture 5 of the Spring 2BL course with Vivek Sharma, students will delve into probability distributions, confidence levels, and the visualization of data through histograms. The lecture covers topics like calculating the mean and standard deviation, understanding the uncertainty in measurements,
3 views • 28 slides

Pharmaceutical Quality Management Systems Market
Meticulous Research\u00ae\u2014a leading global market research company, published a research report titled, \u2018Pharmaceutical Quality Management Systems Market by Solution Type (Deviation, CAPA, Audit, Risk & Compliance, Inspection, Document, Change, Training Management), Deployment Mode (Cloud,
10 views • 3 slides

Challenges in Asset Valuation Using CAPM
Analysis of the Capital Asset Pricing Model (CAPM) for listed companies demonstrates significant discrepancies between the model's results and actual returns. Various factors contributing to this deviation are discussed, including the limitations of the model and potential modifications to enhance i
0 views • 21 slides

Gauteng Department of Social Development 2nd Quarter Performance Analysis 2023/2024
Analyzing the 2nd quarter performance monitoring report of the Gauteng Department of Social Development for 2023/2024 reveals insights into program performance, governance, financial status, and rating categories. The report delves into departmental overview, non-financial performance, and areas of
1 views • 70 slides

Pharmaceutical Quality Management Systems Industry Valued at $3.97 Billion by 20
\nMeticulous Research\u00ae\u2014a leading global market research company, published a research report titled, \n\u2018Pharmaceutical Quality Management Systems Market by Solution Type (Deviation, CAPA, Audit, Risk &\n Compliance, Inspection, Document, Change, Training Management), Deployment Mode (
4 views • 3 slides

Pharmaceutical Quality Management Systems
Meticulous Research\u00ae\u2014a leading global market research company, published a research report titled,\n \u2018Pharmaceutical Quality Management Systems Market by Solution Type (Deviation, CAPA, Audit, Risk\n & Compliance, Inspection, Document, Change, Training Management), Deployment Mode (Cl
2 views • 3 slides

Earth-GRAM Overview and Updates 2023
Earth-GRAM is a global reference atmospheric model providing monthly mean and standard deviation data for various atmospheric variables. It is used in engineering for dispersion simulations but is not a forecasting model. Updates to Earth-GRAM include the Modern Era Retrospective Analysis, a global
1 views • 19 slides

The Rise and Fall of King Solomon: Lessons in Character and Gifting
The narrative unfolds the story of King Solomon from his ascent to power and wisdom to his eventual downfall due to his deviation from God's teachings. It emphasizes the importance of character alongside giftedness and prompts reflection on how one should utilize their gifts in alignment with moral
1 views • 13 slides
Time Complexity in Algorithm Analysis
Explore the concept of time complexity in algorithm analysis, focusing on the efficiency of algorithms measured in terms of execution time and memory usage. Learn about different complexities such as constant time, linear, logarithmic, and exponential, as well as the importance of time complexity co
2 views • 73 slides
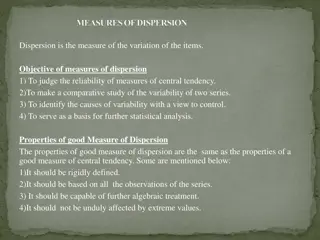
Measures of Dispersion in Statistics
Measures of dispersion in statistics help in understanding the variability of data points. They are essential for assessing the reliability of central tendency measures, comparing data sets, identifying variability causes, and guiding further statistical analysis. The properties of a good measure of
2 views • 8 slides
Effective Protocol Deviation Management in Clinical Research
Understand the importance of handling protocol deviations in clinical trials to ensure patient safety, data integrity, and compliance with regulatory requirements. Explore SOPs, electronic systems, and best practices for managing deviations effectively. Learn about GCP requirements, DMC usefulness,
0 views • 22 slides
Standard Deviation, Variance, and Z-Scores
Explore the importance of variation in interpreting data distributions, learn how to calculate standard deviation, understand z-scores, and become familiar with Greek letters for mean and standard deviation. Discover the significance of standard deviation in statistical analysis and the difference b
2 views • 18 slides

Measures of Variability: Variance and Standard Deviation
This lesson covers the concepts of variance and standard deviation as measures of variability in a data set. It explains how deviations from the mean are used to calculate variance, and how standard deviation, as the square root of variance, measures the average distance from the mean. Degree of fre
4 views • 26 slides

Standard Deviation in National 5 Mathematics
Standard deviation measures the spread of data around the mean, indicating how close or far apart values are from the average. This concept is crucial in analyzing data variability and consistency, with lower values signifying data clustered around the mean and higher values indicating greater dispe
3 views • 12 slides
Descriptive Statistics: Mean, Standard Deviation, and Variance
Explore the fundamentals of descriptive statistics focusing on mean, standard deviation, and variance. Dive into the importance of these measures in interpreting data patterns effectively, with practical examples like analyzing the average height of individuals and understanding central tendency met
1 views • 23 slides

Southern Connecticut State University Core-CT Time and Labor Employee Self Service Overview
Employee Entering Time & Labor Self Service at Southern Connecticut State University allows employees to enter their own time into Core-CT. Employees can access Core-CT using their login and password to enter time on a Positive or Exception basis. Training tools are available to help employees learn
0 views • 23 slides

Calculating Mean and Standard Deviation of Data Sets
Learn how to find the mean and standard deviation of a set of numbers using a calculator. Follow step-by-step instructions with accompanying images to understand the process. Additionally, an example is provided to calculate the mean and standard deviation of monthly salaries based on a frequency ta
2 views • 13 slides
Statistics: Understanding Variance and Standard Deviation
Understand the concepts of population variance, sample variance, and standard deviation. Learn how to calculate these measures for sample and grouped data, and their significance in analyzing data dispersion. Discover the differences between population and sample variance, and when to use each measu
4 views • 11 slides

The Significance of Deviation in Literature
Linguistic deviation in literature serves to disrupt the normal processes of communication, challenging readers with non-traditional expressions and interpretations. Writers use deviation to create unique aesthetic value in their works, prompting readers to delve deeper into unfamiliar compositions
2 views • 12 slides
Time Transfer Statistics in Technical Services
Time transfer in technical services involves transmitting time information between locations, with a focus on statistical measures like Time Deviation (TDEV). This process assesses the noise affecting systems using specialized tools for time and frequency stability analysis. The performance of time
0 views • 29 slides

Cryptocurrency Diversification for Portfolio Optimization
Exploring the suitability of cryptocurrencies for diversification using Modern Portfolio Theory. The study aims to determine optimal portfolio weights for cryptocurrencies, assess the stability of these weights over time, and provide insights on cross-country evidence. Key considerations include ris
1 views • 22 slides
Estimating Population Standard Deviation or Variance in Health Administration Programs
Overview of estimating population standard deviation or variance in health administration programs, including key concepts like point estimates and confidence intervals. Explains critical values of chi-square distribution and provides examples for better understanding.
1 views • 24 slides

Standard Deviation in AP Biology
Standard deviation is a crucial concept in biology that helps analyze variability and distribution of data. This summary provides insights into within-group and between-group variations, normal distribution, and steps to calculate standard deviation using examples and formulas.
1 views • 18 slides

Standard Deviation and Standard Error of the Means
Standard deviation measures the variability or spread of measurements in a data set, while standard error of the means quantifies the precision of the mean of a set of means from replicated experiments. Variability is indicated by the range of data values, with low standard deviation corresponding t
1 views • 7 slides

Estimating Tropical Cyclone Intensity with Infrared Image Data
Estimating Tropical Cyclone Intensity and Genesis from Infrared Image Data. Analyzing data from the Atlantic and Gulf of Mexico using the Deviation-Angle Variance (DAV) technique. Methodology involves mapping DAV, variance maps of Hurricane Wilma, and DAV time series analysis correlating with NHC da
1 views • 18 slides

Learning Dot Plots and Mean Absolute Deviation
In this lesson, students will explore dot plots and measure variation with mean absolute deviation. They will learn to calculate the mean arm span length using a set of data and understand the characteristics impacting the mean absolute deviation. Essential questions guide the learning process, rein
0 views • 103 slides

Statistical Analysis on Pile Length Data
Calculating range, variation, standard deviation, mean deviation, and skewness measure from a table showing pile lengths and frequencies. The process involves finding the range, variation, mean, mean deviation, and skewness using mathematical formulas. The step-by-step analysis includes determining
0 views • 6 slides

Understanding Supplier Deviation Process in Quality Management
The Supplier Deviation Process involves identifying and communicating temporary changes in products or processes to ensure compliance with standards. This process is crucial for maintaining product quality, minimizing risks, and preventing potential recall events. Learn when to use or not use a Supp
0 views • 14 slides
Understanding Statistics: Mode, Median, Average, Standard Deviation & Frequency Tables
Learn the basics of statistics including calculating mode, median, average, standard deviation, and creating frequency tables with practical examples and analysis methodology. Explore the concepts of central tendency and data distribution in detail.
0 views • 7 slides

Understanding Time Transfer Systems and Statistical Measures
Explore the concept of time transfer systems and statistical measures for analyzing time and frequency stability. Learn about time deviation, noise characteristics, and models used for assessing system sensitivities in time transfer performance.
0 views • 29 slides

Essential Measures of Dispersion in Biostatistics
Learn about the importance of dispersion in analyzing data variability, explore ideal properties of dispersion measures, and understand commonly used measures like Range, Mean Deviation, Standard Deviation, Variance, Standard Error, and Coefficient of Variation. Discover how to compute range for ind
0 views • 24 slides
Understanding Descriptive Statistics: Mean, Median, Mode, Variance, and Standard Deviation
Learn how to calculate mean, median, mode, variance, and standard deviation using a sample data set of dog heights. Explore the concept of range and understand the significance of each statistical measure in data analysis.
0 views • 16 slides
Understanding Awareness and Self-Control in Behavioral Science
Explore the concept of awareness in relation to self-control through survey measures and empirical evidence, focusing on the Expected Deviation parameter in financial decision-making among homeless shelter residents. The study delves into how perceived self-control accuracy influences savings behavi
0 views • 19 slides
Hypothesis Testing Procedures and Cases: Understanding Mean and Standard Deviation
Explore hypothesis testing procedures including p-value and critical-value approaches, different cases based on known standard deviation, and how to calculate z-values for sample means. Understand when to reject null hypothesis based on p-values in various scenarios.
0 views • 16 slides

Correcting Movement Deviation in Mechanical System Analysis
Explore the comparison between results from a pure Lumped Mechanical System and Multibody Dynamics analysis, identifying reasons for deviation in movement of components m1 and m2. Discover why the LMS and MBD methods may not align in certain scenarios, offering insights into enhancing model accuracy
0 views • 5 slides