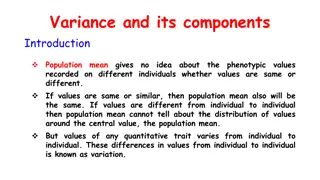
Measures of Variability: Variance and Standard Deviation
This lesson covers the concepts of variance and standard deviation as measures of variability in a data set. It explains how deviations from the mean are used to calculate variance, and how standard deviation, as the square root of variance, measures the average distance from the mean. Degree of freedom in sample variance calculation is also discussed. Examples with a sample of fish lengths are used to illustrate these concepts.

Download Presentation

Please find below an Image/Link to download the presentation.
The content on the website is provided AS IS for your information and personal use only. It may not be sold, licensed, or shared on other websites without obtaining consent from the author.If you encounter any issues during the download, it is possible that the publisher has removed the file from their server.
You are allowed to download the files provided on this website for personal or commercial use, subject to the condition that they are used lawfully. All files are the property of their respective owners.
The content on the website is provided AS IS for your information and personal use only. It may not be sold, licensed, or shared on other websites without obtaining consent from the author.
E N D
Presentation Transcript
Calculator required for this lesson!
Measures of Variability Variance and Standard Deviation
Awesome text messages from parents
Measures of Variability Another measure of the variability in a data set uses the deviations from the mean (x x).
Remember the sample of 6 fish that we caught from the lake . . . They were the following lengths: 3 , 4 , 5 , 6 , 8 , 10 The mean length was 6 inches. Recall that we calculated the deviations from the mean. What was the sum of these deviations? Can we find an average deviation? What can we do to the deviations so that we could find an average?
The estimated average of the deviations squared is called the variance. N ( ) 2 x-m s2=
Standard Deviation - is the square root of the variance. ( ) 2 x-m N s = - is the average distance from the center(mean).
Notations s for populationstandard deviation s for sample standarddeviation
2 ( ) x x = 2 s n 1 Degree of freedom When calculating sample variance, we use degrees of freedom (n 1) in the denominator instead of n because this tends to produce better estimates. Degrees of freedom will be revisited again in Chapter 8.
Remember the sample of 6 fish that we caught from the lake . . . Find the variance of the length of fish. First square the deviations x 3 4 5 6 8 10 Sum (x - x) -3 -2 -1 0 2 4 0 (x - x)2 9 4 1 What is the sum of the deviations squared? Divide this by 5. 0 4 16 34 s2= 6.8
A typical deviation from the mean is the standard deviation. s2= 6.8 inches2so s = 2.608 inches The fish in our sample deviate from the mean of 6 by an average of 2.608 inches.
The most commonly used measures of center and variability are the mean and standard deviation, respectively.
Choosing Measures of Center and Spread - Mean and Standard Deviation - Median and Interquartile Range
The median and IQR are usually better than the mean and standard deviation for describing a skewed distribution or a distribution with outliers. Use mean and standard deviation only for reasonably symmetric distributions that don t have outliers.
Rule of Thumb The range is 4 times as much as the standard deviation.
TI-nspire 1.Go to Lists & spreadsheet 2. Give a name for the column 3. Enter the data under this column 4. Press Menu 5. Choose (4) Statistics 6. Select Stat Calculation 7. Select one-variable statistics 8. Enter 9. Num of Lists 1 (press ok) 10. x1 List . The name of the column where you enter the data 11. Leave others as it is 12. Press ok
Example: This is the key phrase to solve!
Homework Page-71 98 100 103
Wednesday, 18th Test on Chapter-3