Essential Measures of Dispersion in Biostatistics
Learn about the importance of dispersion in analyzing data variability, explore ideal properties of dispersion measures, and understand commonly used measures like Range, Mean Deviation, Standard Deviation, Variance, Standard Error, and Coefficient of Variation. Discover how to compute range for individual values and frequency distributions in statistical analysis.

Download Presentation

Please find below an Image/Link to download the presentation.
The content on the website is provided AS IS for your information and personal use only. It may not be sold, licensed, or shared on other websites without obtaining consent from the author. If you encounter any issues during the download, it is possible that the publisher has removed the file from their server.
You are allowed to download the files provided on this website for personal or commercial use, subject to the condition that they are used lawfully. All files are the property of their respective owners.
The content on the website is provided AS IS for your information and personal use only. It may not be sold, licensed, or shared on other websites without obtaining consent from the author.
E N D
Presentation Transcript
AGB (Unit I) Biostatistics & Computer Application RAKESH GOEL Department of Animal Genetics & Breeding, College of Veterinary Science and Animal Husbandry, U.P. Pt. Deen Dayal Upadhyaya Pashu Chikitsa Vigyan Vishwavidyalaya Evam Go-Anusandhan Sansthan, Mathura 281001 (U.P.) E-mail : goelrakeshvet@gmail.com 1
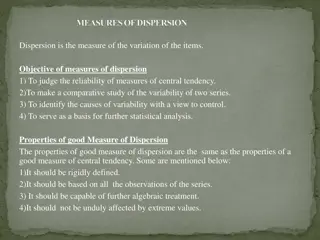
Measure of central tendency tells about the central position of the series. They do not throw like on the formation of series because in some cases, two series may have the same averages but the items in one may scatter widely around its average while in the other case, observations may be close to the average. In this way the central value or an average alone cannot describe the distribution adequately. In order to study the formation, composition, structure, scatteredness of the items of the series. The extent or degree to which data tend to spread around an average is called Dispersion or Variation. Measure of Dispersion also called the averages of second order; help us to measure the scatteredness of observation around an average.
An ideal measure of dispersion should possess the following properties- I. It should be rigidly defined i.e. it has a fixed and finite value II. It should be easy to understand III. It should be easy to calculate IV. Its calculation should be based on all the observations V. It should be capable for further algebraic treatment VI. It should not be affected by extreme values of the observations VII. It should be least affected by fluctuations of sampling
The commonly used measures of dispersion are as follows; Range Mean deviation (M.D.) Standard deviation (S.D.) Variance Standard error (S.E.) Coefficient of variation (C.V.)
It is the difference between the lowest and highest value in the series. Thus Range = L - S Where, L = Largest observation; S = Smallest observation continuous distribution, the range is defined as the difference between the upper limit of the highest class and the lower limit of the smallest class. In case of grouped data, i.e., in case of discrete and
Computation of Range In case of individual values: If x1, x2, x3, ,xn are n observations in a series. Then, range is calculated by- Range = Xmax - Xmin For Example: Calculate range for marks (out of 10) in biostatistics obtained by eight students in a class: Marks: 7 8 4 6.5 9 7.5 6 5 Answer: Range = Xmax - Xmin = 9 4 = 5 In case of discrete frequency distribution: If x1, x2, x3, ,xn are n observations with corresponding frequencies f1,f2,f3, ., fn, respectively. Then the range is calculated by Range = Xmax - Xmin For Example: Calculate range for height(cm) of 5 students as given in the following frequency table: Height(cm) : 20 No. of students : 5 25 8 30 16 35 7 40 4 Answer: Range = Xmax - Xmin = 40 20 = 20
In case of continuous frequency distribution: If C1C2,C2C3,,CnCn+1 are class intervals of data with corresponding frequencies f1,f2,f3, ., fn, respectively. Range = Upper limit of the highest class - Lower limit of the smallest class For Example: Calculate Mode for weekly milk yield (litres) of Hariana cows as given in the following frequency table: Weekly milk yield (Litre) : 10-20 Number of cows : 4 20-30 11 30-40 23 40-50 19 50-60 13 Answer: Range = Upper limit of the highest class - Lower limit of the smallest class Range = 60 10 = 50
Merits of Range It should be rigidly defined i.e. it has a fixed and finite value It should be easy to understand It should be easy to calculate Demerits of Range Its calculation should not be based on all the observations It should not be capable for further algebraic treatment It should be affected by fluctuations of sampling It is very much affected by extreme values of the observations. It cannot be calculated for open end classes. Uses of Range It is used in business and commerce, when there is no greater variability in the series. It is very useful in the field of quality control. Variations in the prices of commodities can be analyzed with the help of range.
It is the arithmetic mean of all the deviation measures for all the items of the series from their arithmetic average by ignoring the signs of the deviation. The mean deviation about mean can be expressed as follows- | | x x = Mean deviation about mean n The mean deviation can also be calculated about median or mode. For grouped data, i.e., in case of discrete and continuous distribution, mean deviation about mean is calculated as- | | f x x = Mean deviation about mean N
Computation of Mean Deviation In case of individual values: If x1, x2, x3, ,xn are n observations in a series. Then, Mean Deviation (M.D.) is calculated by- | | x x = Mean deviation about mean n X = x __ n X x1 X2 . . xn X . .
In case of discrete frequency distribution: If x1, x2, x3,,xn are n observations with corresponding frequencies f1,f2,f3, ., fn, respectively. Then Mean Deviation (M.D.) is calculated by | | f x x = Mean deviation about mean N fX __ = X N Here, N = f1+f2+ .+ fn X f fX x1 f1 f1x1 X2 f2 f2x2 . . . . . . . . . . xn fn fnxn f X f = N
In case of continuous frequency distribution: If C1C2,C2C3,,CnCn+1 are class intervals of data with corresponding frequencies f1,f2,f3, ., fn, respectively. Then Mean Deviation (M.D.) is calculated by | | f m x = Mean deviation about mean N X = fm __ N Here, N = f1+f2+ .+ fn m = Mid value CI f fm C1-C2 f1 m1 f1m1 C2-C3 f2 m2 f2m2 . . . . . . . . . . . . Cn-Cn+1 fn mn fnmn f m f = N
Merits of Mean Deviation It should be rigidly defined i.e. it has a fixed and finite value It should be easy to understand It should be easy to calculate Its calculation should be based on all the observations It is not much affected by extreme values of the observations Demerits of Mean Deviation It should not be capable for further algebraic treatment because in its calculation the signs of deviations are ignored. It should be affected by fluctuations of sampling Uses of Mean Deviation It is used in particularly in business study and socio-economic studies. It is also useful for small sample studies.
It is defined as the square root of the arithmetic mean of the squares of deviations of the observations from the arithmetic mean. It is denoted by Sigma( ). Symbolically = . . ( ) 2 x x ( ) S D n For grouped data, i.e., in case of discrete and continuous distribution, the formula for calculating Standard Deviation is- = . . ( N ) 2 f x x ( ) S D X Where, N = f1+f2+f3+ ..+fn ; Relationship between M.D. and S.D. For any series or frequency distribution, the value of mean deviation (M.D.) and standard deviation (S.D.) are different and their values always follow the following inequality- = Arithmetic mean 4 = . . . . M D S D 5
Computation of S.D. In case of individual values: If x1, x2, x3, ,xn are n observations in a series, then the Standard Deviation(S.D.) is calculated by two methods (Direct or Shortcut) (i) Direct method: = D S ( n ) 2 x x ( ) . . 1 (ii) Shortcut method: X __ = X n (X-a)2 X a= ? X a (x1-a)2 (x2-a)2 . x1 X2 . x1 -a x2 -a . . . . . . . . (xn-a)2 (X-a)2 xn X xn -a
In case of discrete frequency distribution: If x1, x2, x3,,xn are n observations with corresponding frequencies f1,f2,f3, ., fn, respectively. Then the Standard Deviation (S.D.) is calculated by two methods (Direct or Shortcut) Direct method: = D S (i) ( ) 2 f x x ( ) . . 1 N Shortcut method: (ii) ( ) ( ) = 2 2 f X a N a x ( ) . D . S 1 N (X-a)2 f(X-a)2 X f fX X a (x1-a)2 (x2-a)2 . f1(x1-a)2 f2(x1-a)2 . x1 X2 . f1 f2 . f1x1 f2x2 . x1 -a x2 -a . . . . . . . . . . . . . (xn-a)2 (xn-a)2 f(X-a)2 xn fn fnxn fX xn -a N= f
In case of continuous frequency distribution: If C1C2,C2C3,,CnCn+1 are class intervals of data with corresponding frequencies f1,f2,f3, ., fn, respectively. Then Standard Deviation (S.D.) is calculated by two methods (Direct or Shortcut) Direct method: = D S (i) ( ) 2 f m x ( ) . . 1 N Short-cut method: (ii) ( ) ( ) = 2 2 f m a N a x ( ) . D . S 1 N (m-a)2 f(m-a)2 CI f m fm m a (m1-a)2 (m2-a)2 . f1(m1-a)2 f2(m2-a)2 . C1-C2 C2-C3 . f1 f2 . m1 m2 . f1m1 f2m2 . m1 -a m2 -a . . . . . . . . . . . . . . (mn-a)2 f(mn-a)2 f(m-a)2 Cn-Cn+1 fn mn fnmn fm mn -a N= f
Merits of Standard Deviation It should be rigidly defined i.e. it has a fixed and finite value Its calculation should be based on all the observations It should be capable for further algebraic treatment It should be least affected by fluctuations of sampling Demerits of Standard Deviation It is difficult to understand It should not be easy to calculate It is very much affected by extreme values of the observations Uses of Standard Deviation It is used in advance studies. It is the base for calculation the other measures of dispersion like- variance, standard error and coefficient of variance. It is an ideal measure of dispersion.
The square of the standard deviation is known as variance. That means, it is defined as the arithmetic mean of the squares of deviations of the observations from the arithmetic mean. ( ) 2 x x ( ) = 2 Var n In case of grouped data, i.e., in case of discrete and continuous distribution, ( ) Var = ( N ) 2 f x x 2 = Arithmetic mean X Where, N = f1+f2+f3+ ..+fn ;
Merits of Variance It should be rigidly defined i.e. it has a fixed and finite value Its calculation should be based on all the observations It should be capable for further algebraic treatment It should be least affected by fluctuations of sampling. Demerits of Variance It is difficult to understand It should not be easy to calculate It is very much affected by extreme values of the observations Uses of Variance It is used in advance studies. It is highly important in advanced work where it is possible to split the total into several parts, each attributable to one of the factors causing variation in their original series. The smaller the value of variance the lesser the variability or greater the uniformity in the population.
It is the standard deviation of the statistic concerned in simple sampling. The standard error of a sample mean is given by- . . S D = E . . S n In case of grouped data , i.e., in case of discrete and continuous distribution, . . S D = E . . S N
Merits of Standard Error It should be rigidly defined i.e. it has a fixed and finite value, Its calculation should be based on all the observations, It should be capable for further algebraic treatment, It should be least affected by fluctuations of sampling, Demerits of Standard Error It is difficult to understand, It should not be easy to calculate, It is very much affected by extreme values of the observations, Uses of Standard Error It is used in advance studies. In any series, least standard error is desirable. For less standard error- The number of observation should be more in the series The observations are homogenous.
It is the standard deviation, gives an idea about the extent to which observations are scattered around their mean. Thus, two or more distributions having the same mean can be compared directly for their variability with the help of corresponding standard deviations. The following two situations may arise- When two or more distributions having unequal means are to be compared in respect of their variability. When two or more distributions having observations expressed in different units of measurements are to be compared in respect of their scatteredness or variability. For making comparisons in the above two situations, Coefficient of variation (C.V.) is the ratio of standard deviation to the arithmetic mean expressed in percentage. Symbolically, S V C = . . D . . 100 x . . A M
Merits of Coefficient of variation It should be easy to understand It should be easy to calculate It is not affected by extreme values of the observations It should not be affected by fluctuations of sampling. Demerits of Coefficient of variation It should not be rigidly defined. Its calculation should not be based on all the observations It is not capable for further algebraic treatment Uses of Coefficient of variation It has a special use in the case when the two sets of data belong to different of units of measurement. e.g., if in one set there are milk yield of some animals recorded in litres and in the second set there are body weight of these animals recorded in kg, then their variability can be compared with the help of coefficient of variation (C.V.) only. It is useful for making comparisons between two or more distributions in respect of their variability, homogeneity, uniformity or consistency. The distribution having greater coefficient of variation (C.V.) is considered more variable than the other and the distribution with lesser coefficient of variation (C.V.) shows greater consistency, homogeneity and uniformity.
")