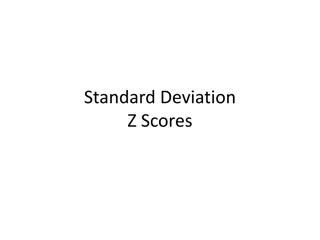
Standard Deviation in AP Biology
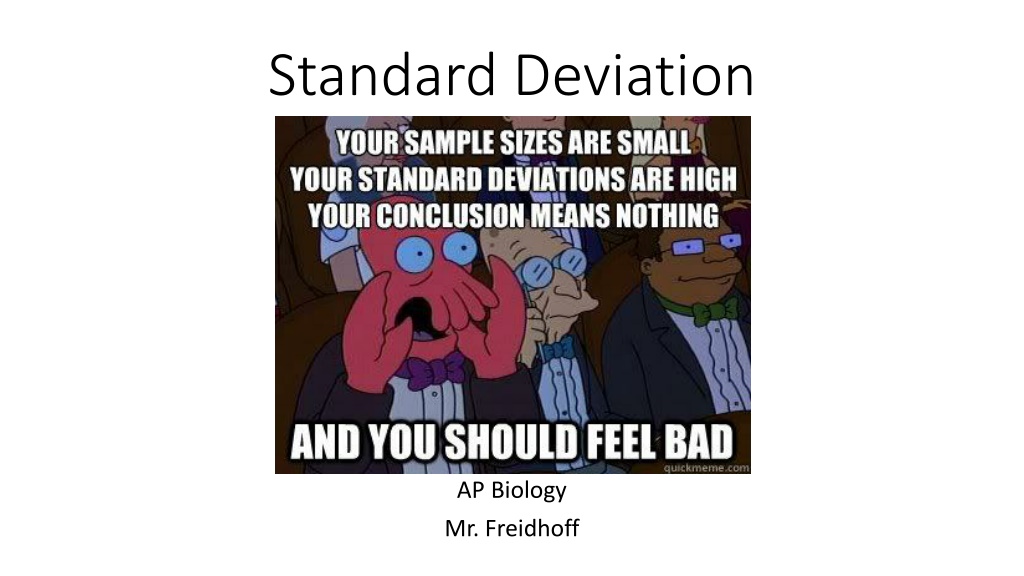

Standard Deviation
AP Biology
Mr. Freidhoff

Standard Deviation
•
Within Group
Variation: Variations
within variables. Not
all the values within
each group are the
same.
•
Dots on graph
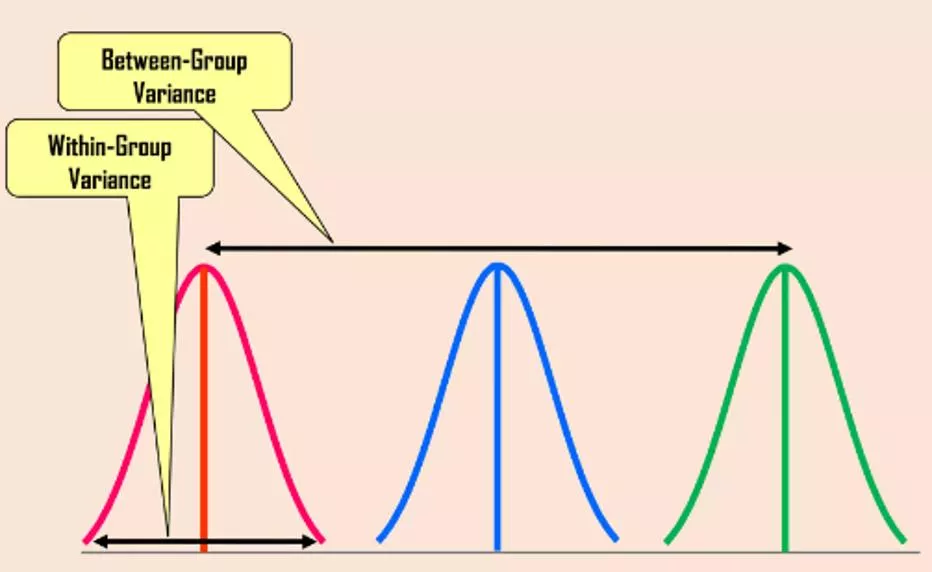
Where is there more within group variation?
Standard Deviation
•
Between Group
Variation: Variations
among all variables.
•
Bars on graph
Where is there more between group
variation?
Standard Deviation
•
Normal Distribution:
probability distribution where the values of a
random variable are distributed symmetrically.
•
“Bell Curve”
Standard Deviation
•
Standard deviation is a measure of how each value in
a data set varies or deviates from the mean.
Standard Deviation
•
68% of data will be within 1 standard deviation.
•
95% of data will be within 2 standard deviations.
•
99% of data will be within 3 standard deviations.
Formula
•
x̅ = Mean
•
x = data point
•
n = Number of points of
data
•
∑ = Summation sign, Sum
•
√ = Square root
Steps to Calculating Standard Deviation
1.
Find the mean of the set of data.
2.
Find the difference between each
value and the mean.
3.
Square the difference.
4.
Find the sum of these squares.
5.
Divide the sum by the number of data
points – one.
6.
Take the square root to find the
standard deviation.
Standard Deviation Example Problem
1.
Find Mean and n.
2.
Find sum of all variation of each
data point compared to mean.
3.
Plug in sum and n.
4.
Solve rest of equation.
•
Data: 1, 2, 3, 4, 5
•
n = 5, Total = 15
•
X = 3
•
Sum = 10
•
Sd = √(10/(n-1))
•
Sd = √(10/4)
•
Sd = √(2.5)
•
Sd = 1.58
Standard Deviation Example Problem
•
Data: 0, 2, 4, 5, 7
•
n = 5
•
X = 3.6
•
SD = 2.70
Example Problems
Standard Deviation Example Problem
•
Data: 5, 10, 15,
15, 30
•
n = 5
•
X = 15
•
SD = 9.35
Standard Deviation Example Problem
Find the mean and the standard deviation for the values 78.2, 90.5, 98.1, 93.7, 94.5.
The mean is 91, and the standard deviation is about 6.8.
Standard deviation is a crucial concept in biology that helps analyze variability and distribution of data. This summary provides insights into within-group and between-group variations, normal distribution, and steps to calculate standard deviation using examples and formulas.

Download Presentation

Please find below an Image/Link to download the presentation.
The content on the website is provided AS IS for your information and personal use only. It may not be sold, licensed, or shared on other websites without obtaining consent from the author.If you encounter any issues during the download, it is possible that the publisher has removed the file from their server.
You are allowed to download the files provided on this website for personal or commercial use, subject to the condition that they are used lawfully. All files are the property of their respective owners.
The content on the website is provided AS IS for your information and personal use only. It may not be sold, licensed, or shared on other websites without obtaining consent from the author.
E N D
Presentation Transcript
Standard Deviation AP Biology Mr. Freidhoff
Standard Deviation Within Group Variation: Variations within variables. Not all the values within each group are the same. Dots on graph
Standard Deviation Between Group Variation: Variations among all variables. Bars on graph
Where is there more between group variation?
Standard Deviation Normal Distribution: probability distribution where the values of a random variable are distributed symmetrically. Bell Curve
Standard Deviation Standard deviation is a measure of how each value in a data set varies or deviates from the mean.
Standard Deviation 68% of data will be within 1 standard deviation. 95% of data will be within 2 standard deviations. 99% of data will be within 3 standard deviations.
Formula x = Mean x = data point n = Number of points of data = Summation sign, Sum = Square root
Steps to Calculating Standard Deviation x 1. Find the mean of the set of data. 2. Find the difference between each value and the mean. 3. Square the difference. 4. Find the sum of these squares. 5. Divide the sum by the number of data points one. 6. Take the square root to find the standard deviation. x x
Standard Deviation Example Problem Data: 1, 2, 3, 4, 5 n = 5, Total = 15 X = 3 Sum = 10 Sd = (10/(n-1)) Sd = (10/4) Sd = (2.5) Sd = 1.58 1. Find Mean and n. 2. Find sum of all variation of each data point compared to mean. 3. Plug in sum and n. 4. Solve rest of equation. (X-X)2 X X (X-X) 1 3 -2 4 2 3 -1 1 3 3 0 0 4 3 1 1 5 3 2 4 Sum = 10
Standard Deviation Example Problem Data: 0, 2, 4, 5, 7 n = 5 X = 3.6 SD = 2.70
Standard Deviation Example Problem Data: 5, 10, 15, 15, 30 n = 5 X = 15 SD = 9.35