Statistical Analysis on Pile Length Data
E
x
a
m
p
l
e
:
f
o
r
t
h
e
f
o
l
l
o
w
i
n
g
t
a
b
l
e
f
i
n
d
r
a
n
g
,
v
a
r
i
a
t
i
o
n
,
s
t
a
n
d
a
r
d
d
e
v
i
a
t
i
o
n
,
m
e
a
n
d
e
v
i
a
t
i
o
n
,
a
n
d
s
k
e
w
n
e
s
s
m
e
a
s
u
r
e
S
o
l
u
t
i
o
n
1
)
R
a
n
g
e
R
=
X
m
a
x
-
X
m
i
n
R
=
7
4
-
3
R
=
7
1
2
)
V
a
r
i
a
t
i
o
n
T
o
f
i
n
d
v
a
r
i
a
t
i
o
n
w
e
m
u
s
t
f
i
n
d
f
i
r
s
t
t
h
e
a
r
i
t
h
m
e
t
i
c
m
e
a
n
E
x
a
m
p
l
e
:
f
o
r
t
h
e
f
o
l
l
o
w
i
n
g
t
a
b
l
e
f
i
n
d
r
a
n
g
,
v
a
r
i
a
t
i
o
n
,
s
t
a
n
d
a
r
d
d
e
v
i
a
t
i
o
n
,
m
e
a
n
d
e
v
i
a
t
i
o
n
,
a
n
d
s
k
e
w
n
e
s
s
m
e
a
s
u
r
e
3
)
S
t
a
n
d
a
r
d
d
e
v
i
a
t
i
o
n
4
)
M
e
a
n
d
e
v
i
a
t
i
o
n
5
a
)
S
k
e
w
n
e
s
s
m
e
a
s
u
r
e
b
y
f
i
r
s
t
t
h
e
o
r
e
m
5
b
)
S
k
e
w
n
e
s
s
m
e
a
s
u
r
e
b
y
s
e
c
o
n
d
t
h
e
o
r
e
m
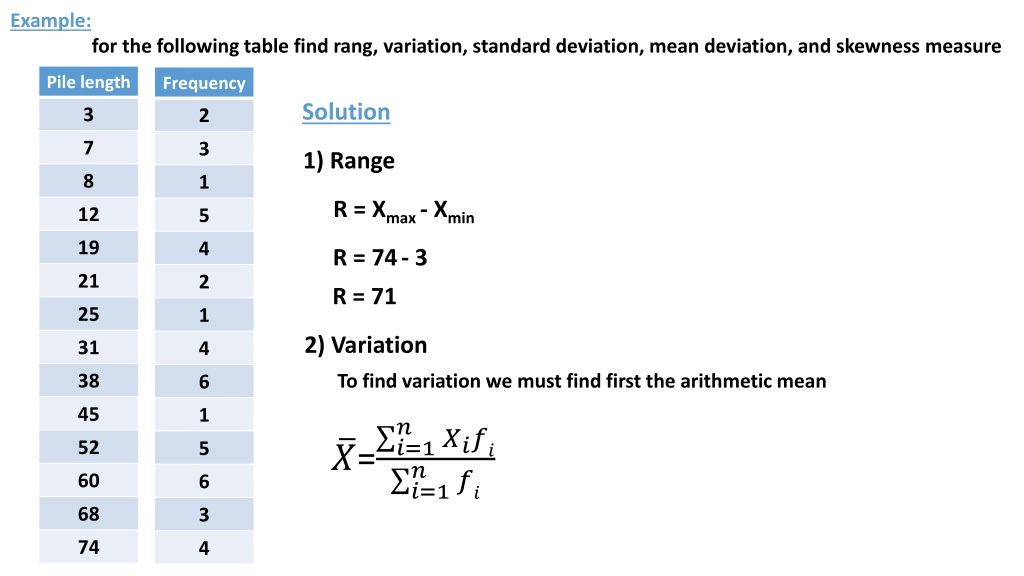
Calculating range, variation, standard deviation, mean deviation, and skewness measure from a table showing pile lengths and frequencies. The process involves finding the range, variation, mean, mean deviation, and skewness using mathematical formulas. The step-by-step analysis includes determining the arithmetic mean and applying the relevant statistical calculations.

Download Presentation

Please find below an Image/Link to download the presentation.
The content on the website is provided AS IS for your information and personal use only. It may not be sold, licensed, or shared on other websites without obtaining consent from the author.If you encounter any issues during the download, it is possible that the publisher has removed the file from their server.
You are allowed to download the files provided on this website for personal or commercial use, subject to the condition that they are used lawfully. All files are the property of their respective owners.
The content on the website is provided AS IS for your information and personal use only. It may not be sold, licensed, or shared on other websites without obtaining consent from the author.
E N D
Presentation Transcript
Example: for the following table find rang, variation, standard deviation, mean deviation, and skewness measure Pile length Frequency Solution 3 2 7 3 1) Range 8 1 R = Xmax- Xmin 12 5 19 4 R = 74- 3 21 2 R = 71 25 1 2) Variation 31 4 38 To find variation we must find first the arithmetic mean 6 45 1 ? ?= ?=1 ???? ?? 52 5 ? ?=1 60 6 68 3 74 4
Example: for the following table find rang, variation, standard deviation, mean deviation, and skewness measure Xi(fi) 3(2)=6 Pile length Frequency ? 3 2 ???? = 6 + 21 + 8 + 60 + 76 + 42 + 25 + ?=1 7 3 7(3)=21 124 + 228 + 45 + 260 + 360 +204+296 8 1 8(1)=8 =1755 12 5 12(5)=60 ? ??= 2 + 3 + 1 + 5 + 4 + 2 + 1 + 4 + 6 + 1 +5 + 6 + 3 + 4 = 47 19 4 19(4)=76 ?=1 21 2 21(2)=42 25 1 25(1)=25 ?=1755 47=37.34 31 4 31(4)=124 38 6 38(6)=228 45 1 45(1)=45 ? 2.?? ? ?= ?=1 ?? (? 1) 52 5 52(5)=260 60 6 60(6)=360 68 3 68(3)=204 74 4 74(4)=296
(Xi - ?)2.fi (Xi - ?)2 (Xi - ?) Pile length (Xi) Frequency ? ? 2.?? = 23797.46 ?? 3 1179.2 -34.34 2 2358.4 7 920.5 -30.34 3 2761.5 ?=1 8 860.8 -29.34 1 860.8 ? = 47 12 642.1 -25.34 5 3210.5 ? 2.?? ? 19 336.6 -18.34 ?= ?=1 4 1346.4 ?? (? 1) 21 267 -16.34 2 534 25 152.3 -12.34 1 152.3 ?=23797.46 (47 1) 31 40.2 -6.34 4 160.8 38 0.44 0.66 6 2.64 45 58.68 7.66 1 58.68 ?=517.334 52 214.92 14.66 5 1074.6 60 513.48 22.66 6 3080.88 68 940.04 30.66 3 2820.12 74 1343.96 36.66 4 5375.84
3) Standard deviation |Xi - ?|.fi |Xi - ?| (Xi - ?) Pile length (Xi) Frequency ? = ?= 517.334 = 22.745 68.68 34.34 3 -34.34 2 91.02 30.34 7 -30.34 3 4) Mean deviation 29.34 29.34 8 -29.34 1 ? ?? ? .?? ? ?.? = ?=1 126.7 25.34 12 -25.34 5 73.36 18.34 19 -18.34 4 32.68 16.34 21 -16.34 2 ? ?? ? .?? = 918.98 12.34 12.34 25 -12.34 1 ?=1 25.36 6.34 31 -6.34 4 ? = 47 3.96 0.66 38 0.66 6 7.66 7.66 45 7.66 1 ?.? =918.98 73.3 14.66 52 14.66 5 47 135.96 22.66 60 22.66 6 ?.? = 19.553 91.98 30.66 68 30.66 3 146.64 36.66 74 36.66 4
5a) Skewness measure by first theorem Pile length (Xi) Cumulative Frequency Frequency ?1=3 ? ? ? 3 2 2 ? = 37.34 7 5 3 8 6 1 ? = 22.745 12 11 5 ? = 47 19 15 4 21 ? 2= 23.5 17 2 25 18 1 31 22 4 ? = 38 38 28 6 ?1=3 37.34 38 22.745 45 29 1 52 34 5 60 40 6 ?1= 0.087 68 43 3 74 47 4
5b) Skewness measure by second theorem (Xi - ?)2.fi (Xi - ?)3.fi (Xi - ?) ?2=?3 ?3 -34.34 2358.4 -80987.5 -30.34 2761.5 -83783.9 ? ?.?? ? ??= ?=1 ?? -29.34 860.8 -25255.9 ? -25.34 3210.5 -81354.1 ? = 22.745 -18.34 1346.4 -24693 ?3= 11766.8 -16.34 534 -8725.6 -12.34 152.3 -1879.4 ? 3.?? ? ?3= ?=1 ?3= 61861.8 ?2= 1316.2 11766.8 ?? -6.34 160.8 -1019.5 ? 0.66 2.64 1.7 ,?3= 1316.2 7.66 58.68 449.5 47 14.66 1074.6 15753.6 ,?2= 0.11 22.66 3080.88 69812.7 30.66 2820.12 86464.9 36.66 5375.84 197078.3


2.fi")
 Standard deviation")
 Skewness measure by first theorem")
 Skewness measure by second theorem")