Cryptocurrency Diversification for Portfolio Optimization
Exploring the suitability of cryptocurrencies for diversification using Modern Portfolio Theory. The study aims to determine optimal portfolio weights for cryptocurrencies, assess the stability of these weights over time, and provide insights on cross-country evidence. Key considerations include risk-adjusted returns, expected returns, standard deviation, and the impact of diversifying across different cryptocurrencies.
Download Presentation

Please find below an Image/Link to download the presentation.
The content on the website is provided AS IS for your information and personal use only. It may not be sold, licensed, or shared on other websites without obtaining consent from the author. Download presentation by click this link. If you encounter any issues during the download, it is possible that the publisher has removed the file from their server.
E N D
Presentation Transcript
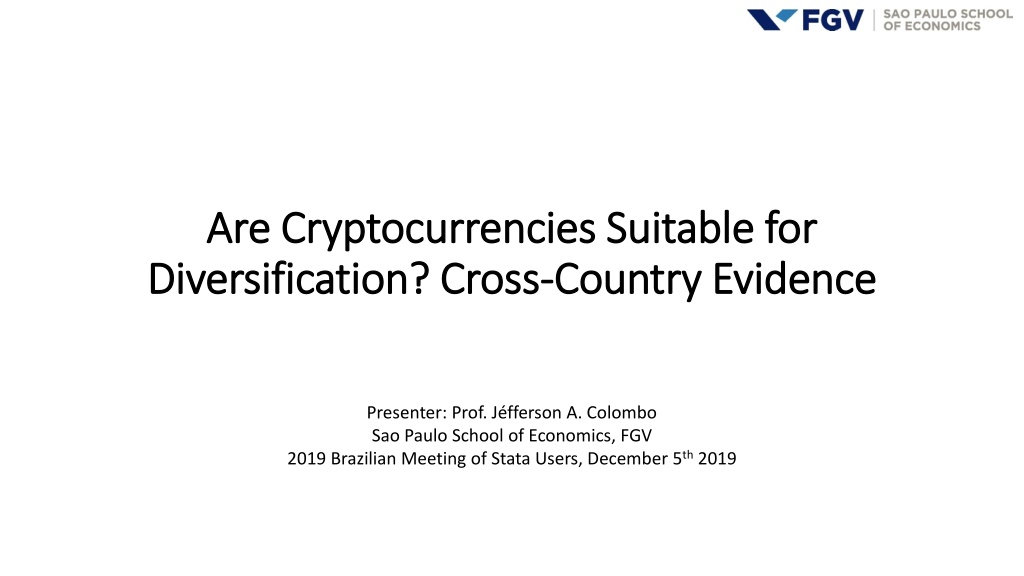
Are Cryptocurrencies Suitable for Are Cryptocurrencies Suitable for Diversification? Cross Diversification? Cross- -Country Evidence Country Evidence Presenter: Prof. J fferson A. Colombo Sao Paulo School of Economics, FGV 2019 Brazilian Meeting of Stata Users, December 5th2019
Outline Outline 1. Motivation and objectives 2. The Modern Portfolio Theory (mean-variance approach) in a nutshell 3. Stata commands to implement the core analyses of the paper 4. Final considerations 2
Introduction Introduction Why does it matter? Why does it matter? Cryptocurrencies became a major topic for individuals, researchers, and regulators in the last years oMedium of exchange? oStore of value? Practical questions our project seeks to provide evidence for: oHow much should one investor hold (if so) of his/her portfolio in cryptocurrencies?? oIf so, is it worth diversifying across cryptocurrencies? oAre the optimal weights of cryptocurrencies stable over time? 3
The Modern Portfolio Theory in a nutshell (1) The Modern Portfolio Theory in a nutshell (1) Core assumption: investors maximize risk-adjusted returns. oKey variables: expected return (?[??]) and standard deviation of returns (??[??]). oHigher ?[??] is good. oHigher ??[??] is bad. oAssumption: no other factors affect utility (e.g., social impacts, environmental-friendly assets, etc.) 4
The Modern Portfolio Theory in a nutshell (2) The Modern Portfolio Theory in a nutshell (2) Figure: ?[??] and ??[??] in 10,000 random allocations of XRP, BTC, ETH and LTC (weekly returns). Higher Utility Source: Colombo, Cruz, Cortes, and Paese (2019). 5
The Modern Portfolio Theory in a nutshell (3) The Modern Portfolio Theory in a nutshell (3) Thinking of a portfolio (a combination of ? assets): ? ?? = ?1?1+ + ???? ? 2?? 2+ ??? ?? = ?? ??????????? ?=1 ? ? Where ? = weights in the portfolio; ? = SD; ? = correlation of returns. Intuition: o The expected return of a portfolio is simply a linear combination of the expected returns of its assets; o The risk of a portfolio is not a linear combination of the risk of its assets it is smaller if ? is lower than the unity. 6
The Modern Portfolio Theory in a nutshell (4) The Modern Portfolio Theory in a nutshell (4) Specifically, we solve the following optimization problem, considering both traditional and non-traditional assets (cryptocurrencies): ? ?? ?? ?? ???.? ???? ????? = ? Subject to ??= 1 ?=1 Where ??= risk free rate (e.g., U.S. Treasury Bills). The optimal weights (? ) are used to build the optimal or tangency portfolio in a given point of time. 7
Correlation matrix: potential diversification Correlation matrix: potential diversification benefits benefits Stock Market Indexes Avg. = 0.49 Stock Market Indexes and Cryptocurrencies Avg. = 0.11 Cryptocurrencies Avg. = 0.50 8 Source: Colombo, Cruz, Cortes, and Paese (2019).
Stata code for implementation Stata code for implementation Command: getsymbols collects and integrates one or more time series from Quandl.com, Google Finance, Yahoo Finance, and Alpha Vantage. oUser written package: Alberto Dorantes (2017). Source of data: Yahoo Finance. oGets data from both stock market indexes and cryptocurrencies: Tickers should match those used in the source of data (e.g., Yahoo Finance) Sample period Frequency Source of data 9 Type of information to be downloaded
Stata code for implementation Stata code for implementation Steps until the final sample oCheck availability of data Dropped Israel and South Africa oOption casewise to keep only non-missing observations for all periods and assets Portfolio optimization: package mvport oUser-written command: Alberto Dorantes (2013) ossc install mvport mvport: Calculates the Minimum Variance financial portfolio given a specific required rate of return and a set of financial returns. 10
Sample Sample 11
a) Command a) Command simport simport Simport: Simulates and makes a graph of random portfolios with non-negative weights given a set of stock returns. Sets the number of portfolios 12 Source: Colombo, Cruz, Cortes, and Paese (2019).
b) Command b) Command cmline cmline cmline - generates and graph the efficient frontier along with the capital market line when adding a risk-free asset. Option: no short sales a) No short sales b) With Short Sales Risk free rate 13 Source: Colombo, Cruz, Cortes, and Paese (2019).
14 Source: Colombo, Cruz, Cortes, and Paese (2019) Table 4 - Global optimal portfolio considering all stock market indices and crytocurrencies.
b) Command b) Command cmline cmline cmline stores the weights for both the weights of the optimal portfolio (tangent portfolio) and the global minimum variance portfolio (GMVP). Other stored results: oReturn oSD oSharpe ratio oBetas Optimal weights of the GMVP portfolio Optimal weights of the tangent portfolio 15
b) Command b) Command cmline cmline 16 Source: Colombo, Cruz, Cortes, and Paese (2019) Table 3 - Optimal weights for the tangent and the global minimum variance portfolios, by country.
Important question: Are the optimal weights Important question: Are the optimal weights stable over time? stable over time? Rolling window optimizations oTime-varying risk-free rates (U.S. 10y Treasury Bonds) oGlobal portfolios (stock market indexes + cryptocurrencies) o52 weeks rolling windows oPeriod-by-period optimization using the cmline comand 17 Source: Colombo, Cruz, Cortes, and Paese (2019) Table 4 - Global optimal portfolio considering all stock market indices and crytocurrencies.
Important question: Are the optimal weights Important question: Are the optimal weights stable over time? stable over time? 18 Source: Colombo, Cruz, Cortes, and Paese (2019) Figure 3.
Further commands for portfolio analysis in the Further commands for portfolio analysis in the MVPORT package MVPORT package backtest - performs a backtest of a financial portfolio. It calculates the holding period return of a specific portfolio cbacktest performs a cumulative backtest of a financial portfolio. gmvport - calculates the global minimum variance portfolio of a set of continuously compounded returns following Portfolio Theory. 19
Final considerations Final considerations MVPORT: user-written Stata package for portfolio optimization MVPORT + GETSYMBOLS: flexible way to download and analyze data for several asset classes oStock market indexes oCryptocurrencies oStocks oBonds oCommodities, etc. Makes portfolio optimization and analyses using Stata pretty easy 20
Thank you! Thank you! Jefferson A. Colombo Assistant Professor of Finance Sao Paulo School of Economics jefferson.colombo@fgv.br
References References Alberto Dorantes, 2013. "MVPORT: Stata module for Collection, Optimization and Backtest of Financial Portfolios," Statistical Software Components S457712, Boston College Department of Economics, revised 02 Sep 2016. Alberto Dorantes, 2017. "GETSYMBOLS: Stata module to collect and integrate one or more series from Quandl.com, Google Finance, Yahoo Finance, and Alpha Vantage," Statistical Software Components S458421, Boston College Department of Economics. Colombo, J. A.; Cruz, F. I. L.; Cortes, R. X.; Paese, L. H. Z. Are Cryptocurrencies Suitable for Portfolio Diversification? Cross-Country Evidence. Working paper. In: 47th Brazilian National Meeting of Economics (ANPEC). Available at: < https://www.anpec.org.br/encontro/2019/submissao/files_I/i8- a2719c2b29132625fa99c7f2b5ed47c3.pdf>. Retrieved November 23rd, 2019. 22
