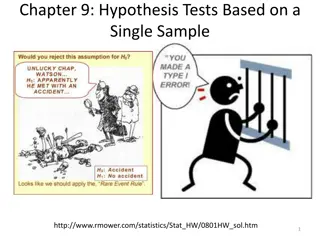
Explore hypothesis testing procedures including p-value and critical-value approaches, different cases based on known standard deviation, and how to calculate z-values for sample means. Understand when to reject null hypothesis based on p-values in various scenarios.
Please find below an Image/Link to download the presentation.
The content on the website is provided AS IS for your information and personal use only. It may not be sold, licensed, or shared on other websites without obtaining consent from the author. If you encounter any issues during the download, it is possible that the publisher has removed the file from their server.
You are allowed to download the files provided on this website for personal or commercial use, subject to the condition that they are used lawfully. All files are the property of their respective owners.
The content on the website is provided AS IS for your information and personal use only. It may not be sold, licensed, or shared on other websites without obtaining consent from the author.
E N D
Presentation Transcript
Statistics Session 22-23 Hypothesis Tests: Introduction and About the Mean, Known Standard Deviation Ezra Halleck, City Tech (CUNY), Fall 2021
Two Procedures Two procedures to make tests of hypothesis 1. The p-value approach 2. The critical-value approach 2
9.2 Hypothesis Tests About Mu : Sigma Known Three Possible Cases Case I. If the following three conditions are fulfilled: 1. The population standard deviation is known 2. The sample size is small (i.e., n < 30) 3. The population from which the sample is selected is normally distributed. 3
Hypothesis Tests About Mu: Sigma Known (1 of 4) Three Possible Cases Case II. If the following two conditions are fulfilled: 1. The population standard deviation is known 2. The sample size is large ( ) n i.e., 30 4
Hypothesis Tests About Mu: Sigma Known(2 of 4) Three Possible Cases Case III. If the following three conditions are fulfilled: 1. The population standard deviation is known 2. The sample size is small (i.e., n < 30) 3. The population from which the sample is selected is not normally distributed (or its distribution is unknown). 5
Hypothesis Tests About Mu: Sigma Known (4 of 4) Assuming that H0 is true, the p-value is the chance that a sample statistic (such as the sample mean) is at least as far away from the hypothesized value in the direction of the H1 as the one obtained from the sample. Note that thep value is the smallest significance level at which the null hypothesis is rejected. Two-Tailed: Right-Tailed: 7
Calculating the z Value for x bar When using the normal distribution, the value of z for x for a test of hypothesis about is computed as follows: x = = z where x n x The value of z calculated for x using this formula is also called the observed value of z. 8
Steps to Perform a Test of Hypothesis Using the p Value Approach 1. State the null and alternative hypothesis. 2. Select the distribution to use. 3. Calculate the p value. 4. Make a decision. 9
Learning a new job At Canon Food Corporation, it used to take an average of 90 minutes for new workers to learn a food processing job. Recently the company installed a new food processing machine. The supervisor at the company wants to find if the mean time taken by new workers to learn the food processing procedure on this new machine is different from 90 minutes. A sample of 20 workers showed that it took, on average, 85 minutes for them to learn the food processing procedure on the new machine. It is known that the learning times for all new workers are normally distributed with a population standard deviation of 7 minutes. Find the p value for the test that the mean learning time for the food processing procedure on the new machine is different from 90 minutes. What will your = .01? conclusion be if 10
Learning a new job: Solution (1 of 2) = Step 1: : 90 : 90 H H 0 1 Step 2:The population standard deviation is known, the sample size is small (n < 30), but the population distribution is normal. We will use the normal distribution to find the p value and make the test. 11
Learning a new job: Solution (2 of 2) Step 3: 7 20 85 1.56524758 = = = 1.56524758minutes x n x 90 = = = z 3.19 x p-value = 2(.0007) = .0014 Step 4: Because = .01 is greater than the p-value of .0014, we reject the null hypothesis at this significance level. Therefore, we conclude that the mean time for learning the food processing procedure on the new machine is different from 90 minutes. 12
Losing Weight The management of Priority Health Club claims that its members lose an average of 10 pounds or more within the first month after joining the club. A consumer agency that wanted to check this claim took a random sample of 36 members of this health club and found that they lost an average of 9.2 pounds within the first month of membership with a standard deviation of 2.4 pounds. Find the p value for this test. What will your decision be if .01? = What if .05? = 13
Losing Weight : Solution (1 of 2) Step 1: 0 : 10 H : 10 H 1 Step 2: The population standard deviation is known, the sample size is large (n > 30). Due to the Central Limit Theorem, we will use the normal distribution to find the p value and perform the test. Step 3: = = = .40 36 9.2 10 2.00 .40 x p-value = .0228 2.4 x n x = = z = 14
Losing Weight : Solution (2 of 2) Step 4: Since = .01 is less than the p-value of .0228, we do not reject the null hypothesis at this significance level. Consequently, we conclude that the mean weight lost within the first month of membership by the members of this club is 10 pounds or more. Because = .05 is greater than the p-value of .0228, we reject the null hypothesis at this significance level. Therefore, we conclude that the mean weight lost within the first month of membership by the members of this club is less than 10 pounds. 15
Hypothesis Tests About Mu: Sigma Known (5 of 6) Test Statistic In tests of hypotheses about using the normal distribution, the random variable x = = z where x n x is called the test statistic. The test statistic can be defined as a rule or criterion that is used to make the decision whether or not to reject the null hypothesis. 16


")
")
")
")


")
")

")
")
")