MasterSoft Student Login: Registration Guide & Dashboard Tour
Understand how to login, retrieve login credentials, access student dashboard, start registration process, and fill out personal and address details efficiently. Enhance your online student experience with step-by-step visual instructions.
1 views • 16 slides
Why Your KPI Dashboard Strategy Might Be Limiting Your Growth Potential
Is your business leveraging its data to its fullest potential? Discover how common KPI dashboard strategies might be inadvertently capping your company's growth and learn strategies to unlock unparalleled expansion and efficiency. Explore the critical role KPI metrics play in shaping business strate
2 views • 5 slides
5 Best Dashboard Software Solutions of 2024_ Unleash Your Data's Full Potential
\nDiscover the 5 best dashboard software solutions of 2024 to transform your data into actionable insights. Find the perfect BI dashboard software for your business needs and unleash the full potential of your data with our expert guide.\n\n
4 views • 4 slides
The Secret Behind High-Growth Startups_ It's All in the KPI Dashboard
KPI Dashboard
0 views • 5 slides
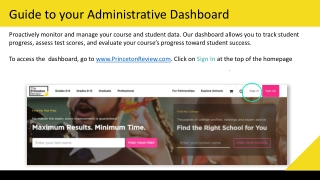
Guide to your Administrative Dashboard
Proactively monitor and manage course and student data using Princeton Review's Administrative Dashboard. Learn how to track student progress, assess test scores, evaluate course progress, and access comprehensive reports for informed decision-making.
3 views • 11 slides
The Ultimate BI Dashboard Tools Comparison_ Which One Is Right for Your Business_
Discover the best BI dashboard tool for your business with our comprehensive comparison. Find out which Business Intelligence dashboard platform aligns with your goals, from data visualization to advanced analytics, and make data-driven decisions with confidence.
3 views • 5 slides
Why Your First Dashboard Tool Might Not Be Your Last_ Lessons in Data Flexibility
Dashboard Tool
0 views • 5 slides
Strategic Plan Training Report Action Item Status in SPOL by Nathan Anderson
This training report details the process of identifying and reporting action items, translating strategic plan terminology to SPOL, updating implementation statuses, and describing these statuses within the SPOL platform. It targets university leaders responsible for reporting MiSU's Strategic Plan
5 views • 48 slides
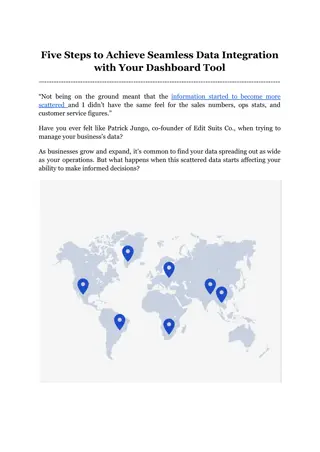
Five Steps to Achieve Seamless Data Integration with Your Dashboard Tool
\nFor your decisions to be derived from data, the ability to seamlessly integrate diverse data streams into a cohesive dashboard is more than a technical achievement; it's a competitive advantage. But what does it truly take to achieve seamless data integration with your Business Intelligence dashbo
5 views • 5 slides
How Data Aggregation Supports Strategic BI Dashboard Development
This explores how combining data from different sources into a clear and organized format is key to making an effective Business Intelligence dashboard.
3 views • 6 slides
Trouble Visualizing Data_ The Best Dashboard Software Can Change Your Perspective
Dive into the world of the best dashboard software with our latest blog. Find out how the right tools can transform your approach to data visualization, making complex information easily understandable and actionable. We explore how enhancing your data analysis capabilities can lead to improved deci
9 views • 7 slides
Interpretation
Interpretation in research methodology involves drawing inferences from collected data, establishing continuity in research, and developing explanatory concepts for future studies. It helps researchers understand abstract principles, make predictions, and maintain research continuity. Interpretation
2 views • 5 slides
Buy Car Dashboard Decor Items | Car Dashboard Accessories – theartarium
Order Car Dashboard Decor Accessories Online - Elegant & Premium Car Decor Idols to add a touch of modernity & class to your car. Shop Now only \n
7 views • 5 slides
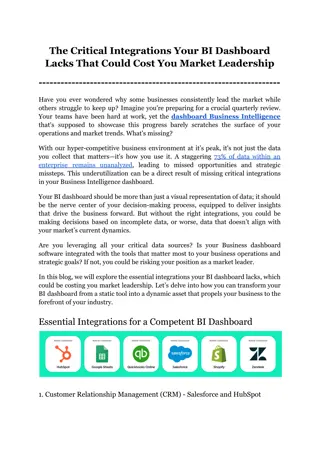
The Critical Integrations Your BI Dashboard Lacks That Could Cost You Market Leadership
Discover the vital integrations your Business Intelligence(BI) dashboard requires to secure and enhance your competitive advantage in the market. This blog provides an in-depth examination of the critical integrations that many Business Intelligence dashboards lack, which could be detrimentally impa
2 views • 5 slides
IGX Orientation 2023: Logging In, Two-Factor Authentication, Dashboard Setup
Step-by-step guide for logging into IGX for the first time, resetting forgotten credentials, setting up two-factor authentication, and customizing the dashboard with panels. Learn how to access your account, ensure security, and personalize your user experience effortlessly.
0 views • 9 slides
Assessment and Accountability Information Meeting Highlights
Discover the key topics covered in the Assessment and Accountability Information Meeting on August 17, 2023, including insights on the California School Dashboard, tools for improvement, School Accountability Report Cards, and more. Learn about the Dashboard's significance in providing valuable data
2 views • 74 slides
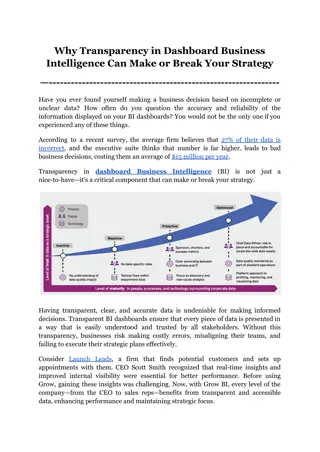
Why Transparency in Dashboard Business Intelligence Can Make or Break Your Strategy
Transparency in dashboard Business Intelligence (BI) is a critical factor that can determine the success or failure of your business strategy. This blog explores how clear, accurate, and accessible data empowers decision-makers, builds trust among stakeholders, and ensures organizational alignment.
0 views • 6 slides
Why Simplified Data Manipulation is the Future of BI Dashboard Software
Discover why simplified data manipulation is revolutionizing BI dashboard software. As businesses strive for real-time insights and data-driven decisions, the need for intuitive and efficient BI tools becomes paramount.
1 views • 6 slides
Enhancing Program Performance through Strategic Metrics Review
Explore the annual program review update process focusing on the importance of standardized program metrics, goals of the program performance review, tactical dashboard metrics, and detailed definitions for benchmarking. Learn how a strategic dashboard complements the review process for continuous i
0 views • 20 slides
Enhancing the Degree Works Experience with the Responsive Dashboard
The Degree Works Responsive Dashboard by Ellucian introduces a modernized tool for students and advisors, offering a mobile-friendly interface, intuitive plan building features, and support for both classic and responsive dashboards. Key components such as student search, advanced search, student he
0 views • 21 slides
Virginia Perspective 2020 State Supervised Eligibility Dashboard
The implementation of Virginia Perspective 2020, a state-supervised and locally-administered program, involves notifying staff through agency broadcasts and email alerts to detect fraud. Eligibility workers receive alerts through VaCMS Dashboard for PARIS matches, ensuring timely actions on case eli
0 views • 10 slides
WebCMS 10.0 Dashboard Features and Functions
Explore the various functionalities of the WebCMS 10.0 Dashboard, including creating new proposals, viewing current proposals, accessing detailed information, and utilizing quick links for editing, approval, archiving, and exporting. The Dashboard provides a streamlined approach to managing programs
0 views • 19 slides
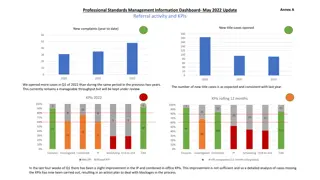
Professional Standards Management Information Dashboard - May 2022 Update
The May 2022 update of the Professional Standards Management Information Dashboard highlights an increase in new cases opened compared to previous years. Key Performance Indicators (KPIs) for 2022 are on track, with some improvements noted in the last quarter. The Registration and Accreditation Mana
0 views • 12 slides
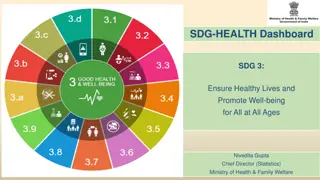
Monitoring Progress of SDG-3 Health Dashboard in India
In India, the Ministry of Health & Family Welfare is actively monitoring the progress of Sustainable Development Goal 3 (SDG-3) through the SDG Health Dashboard. The dashboard facilitates tracking of 73 health indicators, involving various stakeholder ministries. The National Task Force on SDG-3 ove
0 views • 7 slides
Understanding Statutory Interpretation in Legal Context
Explore the intricacies of statutory interpretation, linguistic and non-linguistic methods, and types of interpretation in legal contexts. Uncover the significance of legal reasoning, historical perspectives, and comparisons between Anglo-Saxon and Continental legal cultures. Delve into the complexi
1 views • 17 slides
Healthy Longevity Dashboard for Sierra Leone
Sierra Leone faces challenges in life expectancy and healthcare access, with high rates of child and maternal mortality. The Healthy Longevity dashboard aims to monitor and guide investments in non-communicable diseases (NCDs) and health longevity by tracking indicators across various domains in the
0 views • 15 slides
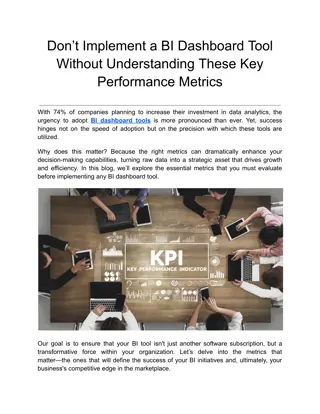
Don’t Implement a BI Dashboard Tool Without Understanding These Key Performance Metrics
Explore the crucial metrics essential for maximizing the effectiveness of BI dashboard tools in our latest blog. Before you implement a BI dashboard, discover which performance indicators are vital to understand, ensuring that your data works as hard
0 views • 5 slides
Advanced Methods of Interpretation: Hermeneutics and Structuralism Lecture at Masaryk University
Understanding interpretation in cultural sociology through hermeneutics and structuralism is explored in Lecture III by Dr. Werner Binder at Masaryk University. The lecture delves into the art of interpretation, focusing on classical hermeneutics, Friedrich Schleiermacher's romantic hermeneutics, an
1 views • 37 slides
Understanding Statutory Interpretation: Rules, Approaches, and Challenges
Explore the concept of statutory interpretation, including the intention of Parliament, problems that can arise, various rules and approaches used in interpretation, aids and presumptions, criticisms, and the relationship between statutory interpretation, EU law, and precedent. The Literal Rule, a c
2 views • 26 slides
A Guide to Talking with Parents About the California School Dashboard
This guide is designed for site administrators to effectively communicate information to parents regarding the California School Dashboard. It covers an overview of the dashboard, details on measures, school performance data, and available parent resources. The deck provides customization tips to ta
0 views • 19 slides
Understanding Dashboard Terminology for December 2020
Exploring the dashboard terminology for December 2020, including concepts like the orange ring of dartboard for domain tabs, the center and rings of dartboard on domain tabs, the green ring of dartboard for Mori Health Equity Report, and more. Learn about the significance of different indicators and
0 views • 11 slides
Enhancing Dashboard Creativity and Widget Usage for Effective Data Management
Explore the world of creative dashboards and worthwhile widgets in this session led by Shelly Rheinfrank. Learn how to change existing dashboards, add new ones, use and create widgets, and deploy navigation tips and tricks. Discover the art of customizing dashboards, adding new dashboards with a spe
0 views • 19 slides
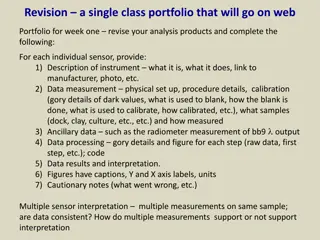
Comprehensive Sensor Portfolio Analysis for Data Interpretation
This portfolio revision focuses on providing detailed descriptions and analysis of individual sensors for data collection and interpretation. It includes information on instrument specifications, data measurement setups, ancillary data, data processing steps, results interpretation, and cautionary n
0 views • 5 slides
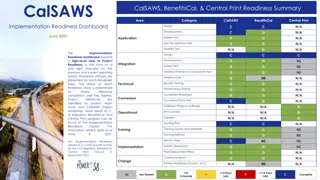
CalSAWS Implementation Readiness Dashboard Summary
The CalSAWS Implementation Readiness Dashboard provides a high-level view of project readiness for CalSAWS, BenefitsCal, and Central Print. It includes status indicators for various readiness areas, key project milestones, and risks. The dashboard reflects data as of June 4, detailing progress in de
0 views • 9 slides
Monitoring Lift Passenger Traffic in EMSD HQS
Submission by Karmo International Company Limited for EMSD E&M InnoPortal focusing on monitoring lift passenger traffic in EMSD HQS. The project entails logging lift lobbies' density, suggesting passengers use less crowded lifts, and displaying lift lobby status on a web-based dashboard. Required da
0 views • 8 slides
Understanding Hermeneutics: Exploring Interpretation and Meaning
Hermeneutics, a vital part of theology and philosophy, delves into understanding text and interpretation. Influenced by prominent thinkers like Heidegger and Ricoeur, it emphasizes the historical encounter and personal experience within the world. The concept of hermeneutical circle and the two area
0 views • 24 slides
MHCLG Online Data Dashboard - Empowering Better Decision Making
Revolutionize the way data is accessed and utilized within the MHCLG through the Online Data Dashboard. This comprehensive tool provides easy access to performance metrics, visualizations, and key outcomes across various policy areas. From tracking progress to enabling policy development and enhanci
0 views • 11 slides
Forensic Biology Data Interpretation Committee Overview
The Biological Data Interpretation and Reporting Committee focuses on establishing best practices, guidelines, and standards for forensic DNA laboratory interpretation. Their goal is to ensure quality and consistency in the forensic community by standardizing scientifically valid methods of interpre
0 views • 26 slides
Real-Time Fleet Management and Data Visualization Dashboard
Chris Lambert from ITS developed a comprehensive real-time dashboard system for snow and ice management. The system aims to publish accurate and timely information, provide real-time fleet management, and visualize rolling data. It offers features like unlimited roll-back, automation of record-keepi
0 views • 24 slides
Building a Custom Workload Dashboard with Netanel Ferdinaro
Learn how to create a personalized workload dashboard with Netanel Ferdinaro. Follow the step-by-step instructions to customize your dashboard, add data sources, and configure display settings. Enhance your monitoring capabilities and analyze workload performance efficiently.
0 views • 9 slides


