Understanding the Standard Normal Distribution in Statistics
Exploring the significance of normal distributions in statistics, this lesson covers the 68-95-99.7 rule, using Table A to find probabilities and z-scores, properties of normal curves, and the standard normal distribution. Key concepts include the mean, standard deviation, and how to standardize variables for analysis.

Download Presentation

Please find below an Image/Link to download the presentation.
The content on the website is provided AS IS for your information and personal use only. It may not be sold, licensed, or shared on other websites without obtaining consent from the author. Download presentation by click this link. If you encounter any issues during the download, it is possible that the publisher has removed the file from their server.
E N D
Presentation Transcript
Random Variables Lesson 5.6 The Standard Normal Distribution Statistics and Probability with Applications, 3rdEdition Starnes & Tabor Bedford Freeman Worth Publishers
The Standard Normal Distribution Learning Targets After this lesson, you should be able to: Use the 68 95 99.7 rule to find approximate probabilities in a normal distribution. Use Table A to find a probability (area) from a z-score in the standard normal distribution. Use Table A to find a z-score from a probability (area) in the standard normal distribution. Statistics and Probability with Applications, 3rdEdition 2 2
The Standard Normal Distribution Why are the Normal distributions important in statistics? Normal distributions are good descriptions for some distributions of real data. Normal distributions are good approximations of the results of many kinds of chance outcomes. Many statistical inference procedures are based on Normal distributions. Statistics and Probability with Applications, 3rdEdition 3 3
The Standard Normal Distribution Although there are many Normal curves, they all have properties in common. The 68-95-99.7 Rule In the Normal distribution with mean and standard deviation : Approximately 68% of the observations fall within of . Approximately 95% of the observations fall within 2 of . Approximately 99.7% of the observations fall within 3 of . Statistics and Probability with Applications, 3rd Edition 4 4
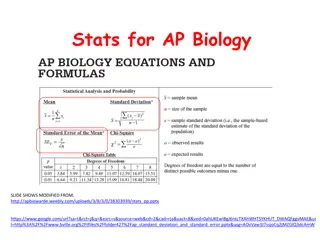
The Standard Normal Distribution All Normal distributions are the same if we measure in units of size from the mean as center. Standard Normal Distribution The standard Normal distribution is the Normal distribution with mean 0 and standard deviation 1. If a variable x has any Normal distribution with mean and standard deviation , then the standardized variable z =x -m s has the standard Normal distribution with = 0 and = 1. Statistics and Probability with Applications, 3rd Edition 5 5
The Standard Normal Distribution The standard Normal Table (Table A) is a table of areas under the standard Normal curve. The table entry for each value z is the area under the curve to the left of z. Suppose we want to find the proportion of observations from the standard Normal distribution that are less than 0.81. We can use Table A: P(z < 0.81) = .7910 Z .00 .7580 .7881 .8159 .01 .7611 .7910 .8186 .02 .7642 .7939 .8212 0.7 0.8 0.9 Statistics and Probability with Applications, 3rd Edition 6 6
The Standard Normal Distribution Let s find the 90th percentile of the standard normal distribution. We re looking for the z-score that has 90% of the area to its left Z .07 .8790 .8980 .9147 .08 .8810 .8997 .9162 .09 .8830 .9015 .9177 1.1 1.2 1.3 z = 1.28 Statistics and Probability with Applications, 3rd Edition 7 7
LESSON APP 5.6 What s a good batting average? 1. In baseball, a player s batting average is the proportion of times that the player gets a hit out of his total number of times at bat. Suppose we select a Major League Baseball player at random. The random variable X= the player s batting average can be modeled by a normal distribution with mean = 0.261 and standard deviation = 0.034. Use the 68 95 99.7 rule to approximate: (a) The probability that a randomly selected player has a batting average greater than 0.329 (b) P(0.193 X 0.295) Suppose we convert the randomly selected player s batting average to a z-score. Use Table A to find each of the following. Draw a standard normal distribution with the desired area shaded in each case. a) What s the probability that the z-score is between 20.58 and 1.79? b) 45% of batting averages will have a z-score greater than what value? 2. Statistics and Probability with Applications, 3rd Edition 8 8
The Standard Normal Distribution Learning Targets After this lesson, you should be able to: Use the 68 95 99.7 rule to find approximate probabilities in a normal distribution. Use Table A to find a probability (area) from a z-score in the standard normal distribution. Use Table A to find a z-score from a probability (area) in the standard normal distribution. Statistics and Probability with Applications, 3rd Edition 9 9