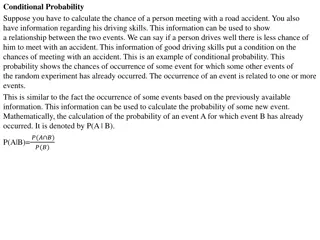
Understanding Negative Binomial Distribution in Probability Theory
Exploring the Negative Binomial Distribution in probability theory can help us analyze scenarios where multiple trials are needed to achieve a certain number of successes. This distribution provides insights into situations like playing carnival games or conducting independent trials with varying success probabilities. Learn about the probability mass function, expectation, variance, and analytical methods associated with the negative binomial distribution.
- Probability theory
- Negative Binomial Distribution
- Independent trials
- Geometric random variables
- Expectation

Download Presentation

Please find below an Image/Link to download the presentation.
The content on the website is provided AS IS for your information and personal use only. It may not be sold, licensed, or shared on other websites without obtaining consent from the author. Download presentation by click this link. If you encounter any issues during the download, it is possible that the publisher has removed the file from their server.
E N D
Presentation Transcript
More Common Discrete CSE 312 Summer 21 Lecture 13 RVs
Announcements Please sign up for small group discussion Office Hours for more help: https://forms.gle/hkXnv1C2dHtBDFL58 I will make assignments sometime over the weekend. Fill this out by Friday. Real World 1 due tonight! Q 1.2a info - Ed Post Think of problems / concepts that you want to review during section. There is a section midterm review handout for preparation!
Scenario: Negative Binomial You re playing a carnival game, and there are ? little kids nearby who all want a stuffed animal. You can win a single game (and thus win one stuffed animal) with probability ? (independently each time) How many times will you need to play the game before every kid gets their toy? More generally, run independent trials with probability ?. How many trials do you need for ? successes?
Activity More generally, run independent trials with probability ?. How many trials do you need for ? successes? What s the pmf? What s the expectation and variance? (hint: linearity)
Negative Binomial Analysis: PMF What s the pmf? Well, how would we know ? = ?? Of the first ? 1 trials, ? 1 must be successes. And trial ? must be a success. That first part is a lot like a binomial! It s the ??(? 1) where ?~Bin(? 1,?) First part gives ? 1 ? 1 1 ?? 1 (? 1)?? 1= Second part, multiply by ? Total: ??? = ? 1 1 ?? ??? ? 1 ? 1 1 ?? ??? 1 ? 1 ??? ? ,? ?
Negative Binomial Analysis: Expectation What about the expectation? To see ? successes: We flip until we see success 1. Then flip until success 2. Flip until success ?. The total number of flips is the sum of geometric random variables!
Negative Binomial Analysis: Expectation Let ?1,?2, ,??be independent copies of Geo(?) ??are called independent and identically distributed or i.i.d. Because they are independent and have identical pmfs. ?~NegBin(?,?) ? = ?1+ ?2+ + ??. ? ? = ? ?1+ ?2+ ?? = ? ?1+ ? ?2+ + ? ?? = ? 1 ?
Negative Binomial Analysis: Variance Let ?1,?2, ,??be independent copies of Geo(?) ?~NegBin(?,?) ? = ?1+ ?2+ + ??. Var ? = Var(?1+ ?2+ + ??) Up until now we ve just used the observation that ? = ?1+ + ??. = Var ?1 + Var ?2 + + Var(??) because the ??are independent. = ? 1 ? ?2
Negative Binomial ?~NegBin(r,p) Parameters: ?: the number of successes needed, ? the probability of success in a single trial ? is the number of trials needed to get the ?thsuccess. ? 1 ? 1 1 ?? ??? ??? = ??(?) is ugly, don t bother with it. ? ? Var X =r 1 p ?2 ? ? =
Scenario: Hypergeometric You have an urn with ? balls, of which ? are purple. You are going to draw balls out of the urn without without replacement. If you draw out ? balls, what is the probability you see ? purple ones?
Hypergeometric: Analysis You have an urn with ? balls, of which ? are purple. You are going to draw balls out of the urn without without replacement. If you draw out ? balls, what is the probability you see ? purple ones? Of the ? purple, we draw out ?. Choose which ? will be drawn Of the ? ? other balls, we will draw out ? ?, choose which (? ?) will be drawn. Sample space all subsets of size ? ? ? ? ? ? ? ? ?
Hypergeometric: Analysis ? = ?1+ ?2+ + ?? Where ??is the indicator that draw ? is purple. ?1is 1 with probability ?/?. What about ?2? ?2= 1 =? 1 ? 1 ? ? 1 ? ? ? =? ? ?+? 1 ? ? 1 =? ?+ ? ? In general, ??= 1 =? It might feel counterintuitive, but it s true! ?
Hypergeometric: Analysis ?[?] = ? ?1+ ?? = ? ?1+ + ? ?? = ? ? ? Can we do the same for variance? No! The ??are dependent. Even if they have the same probability.
Hypergeometric Distribution ?~HypGeo(?,?,?) Parameters: A total of ? balls in an urn, of which ? are successes. Draw ? balls without replacement. ? is the number of success balls drawn. ? ? ? ? ? ? ? ? ??? = ? ? =?? ? Var ? = ? ? ? ? ? ? ? ? 1 ?
The Poisson Distribution A new kind of random variable. We use a Poisson distribution when: We re trying to count the number of times something happens in some interval of time. We know the average number that happen (i.e. the expectation) Each occurrence is independent of the others. There are a VERY large number of potential sources for those events, few of which happen.
The Poisson Distribution Classic applications: How many traffic accidents occur in Seattle in a day? How many major earthquakes occur in a year (not including aftershocks)? How many customers visit a bakery in an hour? Why not just use counting coin flips? What are the flips the number of cars? Every person who might visit the bakery? There are way too many of these to count exactly or think about dependency between. But a Poisson might accurately model what s happening.
Its a model By modeling choice, we mean that we re choosing math that we think represents the real world as best as possible Is every traffic accident really independent? Not really, one causes congestion, which causes angrier drivers. Or both might be caused by bad weather/more cars on the road. But we assume they are (because the dependence is so weak that the model is useful).
Poisson Distribution ?~Poi(?) Let ? be the average number of incidents in a time interval. ? is the number of incidents seen in a particular interval. Support ??? =??? ? ?! ? ?? ?! ? ? = ? (for ? ) ??? = ? ? ?=0 Var ? = ?
Some Sample PMFs PMF for Poisson with lambda=1 PMF for Poisson with lambda=5 0.4 0.4 0.35 0.35 0.3 0.3 0.25 0.25 0.2 0.2 0.15 0.15 0.1 0.1 0.05 0.05 0 0 0 5 10 0 5 10
Lets take a closer look at that pmf ??? =??? ? ?! (for ? ) If this is a real PMF, it should sum to 1. Let s check that to understand the PMF a little better. ??? ? ?! ?=0 Taylor Series for ?? ?? ?!= ?? ?? ?! = ? ? ?=0 = ? ???= ?0= 1 ?=0
Lets check somethingthe expectation ? ? ??? ? ? = ?=0 ?! ? ? ??? ?! first term is 0. ?? (? 1)! cancel the ?. ? ??? 1 = ?=1 ? ? = ?=1 (? 1)! factor out ?. ? ??? = ? ?=1 (?)! Define ? = ? 1 = ? ?=0 = ? 1 The summation is just the pmf!
Where did this expression come from? For the cars we said, it s like every car in Seattle independently might cause an accident. If we knew the exact number of cars, and they all had identical probabilities of causing an accident It d be just like counting the number of heads in ? flips of a bunch of coins (the coins are just VERY biased). The Poisson is a certain limit as ? but ?? (the expected number of accidents) stays constant.
Zoo! ?~???(?) ?~???(?) ?~???(?,?) ?~????(?,?) ? ? ? ??? = ? ?; ??? = ? ??? = ? ?? ?? ? ? =? ? ??? ? =? ? ??? ?? ? ??? = ??? = ? ? =? + ? ? ? + ? ? ? = ? ? ? = ?? ? ? ? ? ? + ? ?? ??? ? = ?? ??? ? = ?(? ?) ??? ? = ??(? ?) ?~??????(?,?,?) ?~??????(?,?) ?~???(?) ? ? ? ? ? ? =? ??? =??? ? ? ? ? ? ? ? ? ? ??? ?? ? ??? = ??? = ?! ? ? = ?? ? ? = ? ? ? ??? ? =?(? ?) ??? ? =?(? ?)(? ?) ??(? ?) ??? ? = ? ??
Zoo Takeaways You can do relatively complicated counting/probability calculations much more quickly than you could week 1! You can now explain why your problem is a zoo variable and save explanation on homework (and save yourself calculations in the future). Don t spend extra effort memorizing but be careful when looking up Wikipedia articles. The exact definitions of the parameters can differ (is a geometric random variable the number of failures before the first success, or the total number of trials including the success?)
What have we done over the past 5 weeks? Counting Combinations, permutations, indistinguishable elements, starts and bars, inclusion- exclusion Probability foundations Events, sample space, axioms of probability, expectation, variance Conditional probability Conditioning, independence, Bayes Rule Refined our intuition Especially around Bayes Rule
Whats next? Continuous random variables. So far our sample spaces have been countable. What happens if we want to choose a random real number? How do expectation, variance, conditioning, etc. change in this new context? Mostly analogous to discrete cases, but with integrals instead of sums. Analysis when it s inconvenient (or impossible) to exactly calculate probabilities. Central Limit Theorem (approximating discrete distributions with continuous ones) Tail Bounds/Concentration (arguing it s unlikely that a random variable is far from its expectation) A first taste of making predictions from data (i.e., a bit of ML)
Practice: Poisson Seattle averages 3 days with snowfall per year. Suppose that the number of days with snow follows a Poisson distribution. What is the probability of getting exactly 5 days of snow? According to the Poisson model, what is the probability of getting 367 days of snow?
Practice: Poisson Let ?~Poi(3). ??5 =35? 3 Or about once a decade. .1008 5! Probability of 367 snowy days, err The distribution says ??367 1.8x10 610. Definition of a year says probability should be 0.
Practice Problem: Coin Flips There are two coins, heads up, on a table in front of you. One is a trick coin both sides are heads. The other is a fair coin. You are allowed 2 coin flips (total between the two coins) to figure out which coin is which. What is your strategy? What is the probability of success?
Flip each once With probability 1 when we flip the trick coin it shows heads. With probability the fair coin shows tails, and we know it s the fair one. With probability , both the coins were heads and we have learned nothing. So, we have a chance of guessing which is which. 1 2 1 +1 2 1 2=3 4 chance of success
Flip one twice. Now flip the same coin twice. We ll see a tails with probability 1 If we don t see a tails, just guess the other one? What s our probability of guessing right? Let ?be the event we re flipping the trick coin ? be the event we saw no tails 1 1 2 1 1 2 2 3 4=3 8 ? ? = (?|?) ? =4 = 2+1 4 1 (?) 5 Guess right: 1 3 8+4 5 5 8=7 8 Better to flip the same coin twice!
Practice Problem: Donuts You are buying at most 7 donuts (could be 0, could be 1, , could be 7). There are chocolate, strawberry, and vanilla donuts. How many different orders could you make give a simple formula!
Donuts: Approach 1 Use the sum rule over the possible numbers of donuts. For ? donuts, by the stars and bars formula there are ?+3 1 3 1 So we have ?=0 Use pascal s rule. Rewrite 2 correct. But not simple yet ?+3 1 3 1 7 2 as 3 , that can combine with ?+1 3 We ll get until you get ? 2+ = ? 3= ?+1 3 2 7+3 1+1 3 10 3
Donuts: Approach 2 Clever way: a fourth type of donut: the don t-buy-one donut. Then we re buying exactly seven donuts of the four types (chocolate, strawberry, vanilla, don t-buy-one) By stars and bars 7+4 1 4 1 = 10 3.