Understanding Uncertainty with Estimation and Standard Error
Explore the concept of estimating with uncertainty, focusing on calculating a mean and using standard error to describe the uncertainty in that mean. Delve into human height, a variable described by a normal distribution, to understand how samples may deviate from the true mean. Discover sampling error and methods to describe variation in estimates within a statistical context.

Download Presentation

Please find below an Image/Link to download the presentation.
The content on the website is provided AS IS for your information and personal use only. It may not be sold, licensed, or shared on other websites without obtaining consent from the author. Download presentation by click this link. If you encounter any issues during the download, it is possible that the publisher has removed the file from their server.
E N D
Presentation Transcript
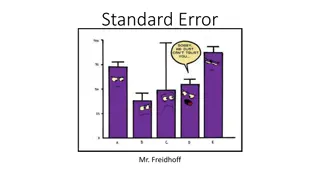
Estimating with uncertainty 1) Calculate a mean 2) Standard Error as a way to describe uncertainty in that mean 1
Estimating with uncertainty This video follows the line of thinking in Michael Morrissey s book, Elementary Statistical Modeling 2
Human height is well described by a normal distribution Imagine: True mean ht.: 148 True standard deviation: 12 3 Modified from: Albert Blakeslee, Journal of Heredity, Volume 5, Issue 11, November 1914, Pages 511 518
Human height is well described by a normal distribution Imagine: True mean ht.: 148 True standard deviation: 12 Would the mean of a sample (n=10) equal exactly 148? Would the mean of second sample (n=10) equal exactly 148? Would the means of the two sets of samples equal each other? Sampling Error How can we describe the variation in our estimates? 4 Modified from: Albert Blakeslee, Journal of Heredity, Volume 5, Issue 11, November 1914, Pages 511 518
Human height is well described by a normal distribution Imagine: True mean ht.: 148 True standard deviation: 12 Would the mean of a sample (n=10) equal exactly 148? Would the mean of second sample (n=10) equal exactly 148? Would the means of the two sets of samples equal each other? Sampling Error How can we describe the variation in our estimates? 5 Modified from: Albert Blakeslee, Journal of Heredity, Volume 5, Issue 11, November 1914, Pages 511 518
Human height is well described by a normal distribution Imagine: True mean ht.: 148 True standard deviation: 12 Would the mean of a sample (n=10) equal exactly 148? Would the mean of second sample (n=10) equal exactly 148? Would the means of the two sets of samples equal each other? Sampling Error How can we describe the variation in our estimates? 6 Modified from: Albert Blakeslee, Journal of Heredity, Volume 5, Issue 11, November 1914, Pages 511 518
Human height is well described by a normal distribution Imagine: True mean ht.: 148 True standard deviation: 12 Would the mean of a sample (n=10) equal exactly 148? Would the mean of second sample (n=10) equal exactly 148? Would the means of the two sets of samples equal each other? Sampling Error How can we describe the variation in our estimates? 7 Modified from: Albert Blakeslee, Journal of Heredity, Volume 5, Issue 11, November 1914, Pages 511 518
Human height is well described by a normal distribution Imagine: True mean ht.: 148 True standard deviation: 12 Would the mean of a sample (n=10) equal exactly 148? Would the mean of second sample (n=10) equal exactly 148? Would the means of the two sets of samples equal each other? Sampling Error How can we describe this variation? 8 Modified from: Albert Blakeslee, Journal of Heredity, Volume 5, Issue 11, November 1914, Pages 511 518
Human height is well described by a normal distribution Imagine: True mean ht.: 148 True standard deviation: 12 We will explore these questions by simulating this imaginary population. 9 Modified from: Albert Blakeslee, Journal of Heredity, Volume 5, Issue 11, November 1914, Pages 511 518
What does Standard Error (SE) mean? If we repeated an experiment many times and calculated the mean for each experiment, the standard deviation of these means (SE) quantifies the effect of sampling error on obtaining an estimate. We rarely know a pop n true sd; so we estimate it: SE = sd(X) / n X is our sample Standard Error (or Standard Error of the mean ) provides a sense of uncertainty in our estimated mean; a small SE suggests a lower influence of sampling error when estimating our mean. 11
This formula for SE makes predictions regarding sampling error: The SE of X equals: sd(X) / n How does population sd affect SE? How does sample size affect SE? 12


 mean?")