Estimating Margin of Error in Statistics and Probability

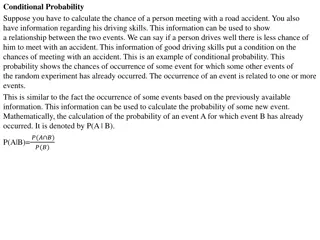
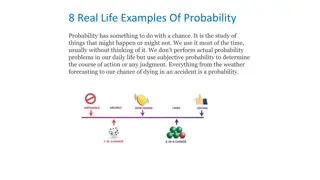
The lesson focuses on estimating the margin of error for sample proportions and means using simulations. It explains the importance of random sampling in providing insights into population characteristics and how different samples can produce varying estimates. The margin of error is defined as the range within which we expect an estimate to deviate from the true population value. A practical example from a Harris Poll on Valentine's Day expectations illustrates the application of margin of error calculations in real-life data analysis.

Download Presentation

Please find below an Image/Link to download the presentation.
The content on the website is provided AS IS for your information and personal use only. It may not be sold, licensed, or shared on other websites without obtaining consent from the author. Download presentation by click this link. If you encounter any issues during the download, it is possible that the publisher has removed the file from their server.
E N D
Presentation Transcript
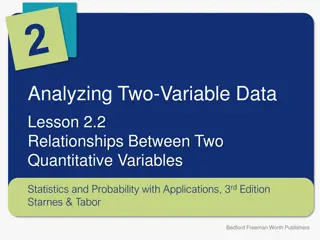
Collecting Data Lesson 3.4 Estimating a Margin of Error Statistics and Probability with Applications, 3rdEdition Starnes & Tabor Bedford Freeman Worth Publishers
Estimating a Margin of Error Learning Targets After this lesson, you should be able to: Use simulation to approximate the margin of error for a sample proportion and interpret the margin of error. Use simulation to approximate the margin of error for a sample mean and interpret the margin of error. Statistics and Probability with Applications, 3rdEdition 2 2
Estimating a Margin of Error In Lesson 3.3, you learned that the purpose of random sampling is to provide information about a larger population. You also learned that different random samples from the same population will produce different estimates for a population proportion or a population mean. In this lesson, you will learn how to approximate and interpret the margin of error for a sample proportion and a sample mean. Margin of Error The margin of error of an estimate describes how far, at most, we expect the estimate to vary from the true population value. Statistics and Probability with Applications, 3rdEdition 3 3
Estimating a Margin of Error Estimating the Margin of Error for a Proportion To estimate the margin of error for a sample proportion resulting from a random sample of size n: 1. Simulate the distribution of the sample proportion for many random samples of size n assuming that the true population value is equal to the sample proportion from the original sample. 2. Multiply the standard deviation of the simulated distribution by 2 to get the margin of error. Statistics and Probability with Applications, 3rd Edition 4 4
Cant buy me love (or can you?) Can t buy me love (or can you?) Margin of error for a proportion Margin of error for a proportion PROBLEM: A recent Harris Poll (http://www.harrisinteractive.com/vault/Harris%20Poll%2012%20- %20Valentine's%20Day_2.12.2015.pdf) surveyed a random sample of 2232 U.S. adults. Overall, 33% of the people in the sample somewhat or strongly agreed that they expect to receive gifts on Valentine s Day. The dotplot shows the proportion who somewhat or strongly agree that they expect to receive gifts on Valentine s Day in each of 500 random samples of size 2232 from a population where 33% would somewhat or strongly agree. Statistics and Probability with Applications, 3rd Edition 5 5
Cant buy me love (or can you?) Can t buy me love (or can you?) Margin of error for a proportion Margin of error for a proportion (a) Use the results of the simulation to approximate the margin of error for the Harris Poll s estimate of the proportion of U.S. adults who somewhat or strongly agree that they expect to get Valentine s Day gifts. margin of error ?(?.???) = ?.??? (b) Interpret the margin of error. We expect the true proportion of all U.S. adults who somewhat or strongly agree that they expect to receive gifts on Valentine s Day to be at most 0.022 from the estimate of 0.33. Statistics and Probability with Applications, 3rd Edition 6 6
Estimating a Margin of Error Estimating the Margin of Error for a Mean To estimate the margin of error for a sample mean resulting from a random sample of size n: 1. Simulate the distribution of the sample mean for many random samples of size n taken with replacement from the original sample. 2. Multiply the standard deviation of the simulated distribution by 2 to get the margin of error. Statistics and Probability with Applications, 3rd Edition 7 7
Are we there yet? Are we there yet? Margin of error for a mean Margin of error for a mean PROBLEM:One question in the Census at School survey is How long does it usually take you to get to school? Students were instructed to round to the nearest minute. Here is a random sample of the responses from 20 U.S. students from grades 9-12: 15 3 8 25 17 40 30 20 8 5 25 20 10 6 10 10 25 10 24 8 The sample mean for these data is ? = 15.95 min. The dotplot shows the distribution of the sample mean time to travel to school for 400 random samples of size 20 taken with replacement from the original sample. Statistics and Probability with Applications, 3rd Edition 8 8
Are we there yet? Are we there yet? Margin of error for a mean Margin of error for a mean (a) Use the results of the simulation to approximate the margin of error for the estimate of the mean time to travel to school. margin of error ?(?.???) = ?.??? min. (b) Interpret the margin of error. We expect the true mean travel time to school for all U.S 9th-12th grade students who took the Census at School survey to be at most 4.234 min from the estimate of 15.95 min. Statistics and Probability with Applications, 3rd Edition 9 9
LESSON APP 3.4 Can you roll your tongue? Many people can roll their tongues, but some can t. Javier is interested in determining the proportion of students at his school that can roll their tongue. In a random sample of 100 students, Javier determines that 70 can roll their tongue. The dotplot below shows the proportion of people who can roll their tongue in each of 500 random samples of size 100 from a population where 70% can roll their tongue. 0.85 Statistics and Probability with Applications, 3rd Edition 10 10
LESSON APP 3.4 Can you roll your tongue? 0.85 1. Use the results of the simulation to approximate the margin of error for Javier s estimate of the proportion of students at his school that can roll their tongue. Interpret the margin of error. Javier s biology teacher claims that 75% of people can roll their tongue. According to Javier s study, is this claim plausible? Explain. Explain how Javier could decrease the margin of error. 2. 3. 4. Statistics and Probability with Applications, 3rd Edition 11 11
LESSON APP 3.4 Can you roll your tongue? 1. Use the results of the simulation to approximate the margin of error for Javier s estimate of the proportion of students at his school that can roll their tongue. 2. Interpret the margin of error. 3. Javier s biology teacher claims that 75% of people can roll their tongue. According to Javier s study, is this claim plausible? Explain. 4. Explain how Javier could decrease the margin of error. Statistics and Probability with Applications, 3rd Edition 12 12
Estimating a Margin of Error Learning Targets After this lesson, you should be able to: Use simulation to approximate the margin of error for a sample proportion and interpret the margin of error. Use simulation to approximate the margin of error for a sample mean and interpret the margin of error. Statistics and Probability with Applications, 3rd Edition 13 13


")
")