National Grade 6 Assessments 2019 Results Summary

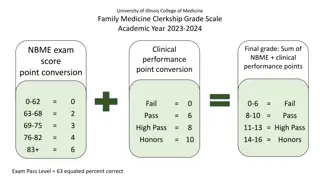
Ministry of Education and Human Resource Development released the results of the 2019 Grade 6 National Assessments. The summary includes data on entry statistics, gender distribution, mean raw scores by gender and district, error checking, error spotting, and math distribution of grades. Girls continue to outperform boys in math scores. The assessment covered various subjects including Mathematics, Language Arts, and Science.

Download Presentation

Please find below an Image/Link to download the presentation.
The content on the website is provided AS IS for your information and personal use only. It may not be sold, licensed, or shared on other websites without obtaining consent from the author. Download presentation by click this link. If you encounter any issues during the download, it is possible that the publisher has removed the file from their server.
E N D
Presentation Transcript
Ministry of Education and Human Resource Development Official Release of the Results of the 2019 GRADE 6 NATIONAL ASSESSMENTS
2019 GRADE 6 NATIONAL ASSESSMENT Resultssummary
ENTRY Sex Girls Boys Grand Total E 48 49 N 98 88 S 65 58 W 230 199 Total 441 394 97 186 123 429 835
Error Checking? Scatterplot of MATHRAW vs LA_1RAW 60 50 40 MATHRAW 30 20 10 0 0 10 20 30 40 50 60 LA_1RAW
Error Spotting! 1364FCDDBCABACACBADDABBCBDDDCBADBADCDADBCDACAADBCBDCCCDBACDBAACAD *MADBACBABCCBBAACACBBBABACBABCDAACBCBDDACBCBBDCDBADDDCBBCAADCB*** 1362MCDDDCBABCDACBDAABBDBABACBCBBDAACABBDDACBCBBCABADDCADBCDADCAC 1363MADBACBABCCBBAACACBBBABACBABCDAACBCBDDACBCBBDCDBADDDCBBCAADCB
Mean raw score by gender 2019 LA 1 40.01 36.42 38.31 LA 2 26.72 23.86 25.37 M SS SC No. 441 394 835 Girls Boys All 37.57 35.9 36.78 29.43 27.08 28.32 31.53 30.22 30.91 2018 LA 1 40.47 36.02 38.2 LA 2 26.82 23.99 25.38 M SS SC 33.5 31.99 32.73 No. 459 478 937 Girls Boys All 39.05 36.68 37.84 31.09 29.07 30.06
Mean raw score by district 2019 LA1/60 35.05 39.35* 35.7* 39.35 38.31 LA2/40 MATH/60 SOC/50 26.28* 33.18 25.22 36.55 22.98* 34.6 25.91 38.32 25.37 36.78 SCI/50 29 31.52 29.58 31.47 30.91 East North South West All 25.15 28.61 25.69 29.67 28.32 2018 LA1/60 LA2/40 MATH/60 SOC/50 SCI/50 East North South West All 36.5 37.18 34.83 40.46 38.2 25.28 25.41 22.82 26.35 25.38 36.66 37.81 34.94 39.28 37.84 28.66 29.53 28.1 31.46 30.06 31.39 32.49 31.28 33.77 32.73
P 2 f o s l a t o t s t n i o 1 0 8 G 6 u t s A N b s t n e d g y e n . r e d 7 0 S E X F M 6 0 5 0 y c n e u q e r F 4 0 3 0 2 0 0 1 0 3 6 9 2 1 A T 5 1 8 1 2 1 T O _ L P T
Maths distribution of grades A 48 28 76 B C D 76 73 149 E 39 48 87 103 96 199 175 149 324 Girls Boys All Girls Continue to outperform boys in every area
Histogram of MATHRAW Normal Distribution of Math Scores Mean 36.78 StDev N 90 11.07 835 80 70 60 Frequency 50 40 30 20 10 0 7.5 15.0 22.5 30.0 MATHRAW 37.5 45.0 52.5 60.0
LA distribution of grades A 49 19 68 B C D 40 59 99 E 26 55 81 Number 440 394 834 103 64 167 222 197 419 F M All Gender disparities continue with More girls receiving the higher grades and more boys receiving D s and E s.
LA Score distribution Histogram of LATOT_RAW Normal 90 Mean 63.68 StDev 15.67 N 80 834 70 60 Frequency 50 40 30 20 10 0 25.0 37.5 50.0 LATOT_RAW 62.5 75.0 87.5 100.0
Percent students scoring <40% 2019 LA 1 LA 2 M Sc SS 6.5 6.3 13.8 12.7 10.2 Girls 13.7 12.7 18 21.5 11.7 Boys 9.9 9.3 15.9 16.9 10.9 All
Graphic showing percent of students with weak performance 25 Girls Boys 20 15 10 5 0 LA 1 LA 2 M Sc SS
Graphic showing percent of students with strong performance Chart Title 30 25 20 15 10 5 0 LA 1 LA 2 M Sc SS Girls Boys
Relationship of school performance with school size Scatterplot of Total vs Entry 460 440 420 400 TOtal 380 360 340 320 300 0 10 20 30 40 50 60 70 80 90 Entry
Relationship of school performance with school size Results again show that there is no direct relationship between school size Some small schools outperformed some of the larger schools Likewise, some large schools outperform some of the smaller schools.
Top performing schools 2019 School Total Std. No. PioneerPreparatorySchool 453.7 10 LighthouseChristianAcademy 440.3 2 PenvillePrimary 436.1 8 ChristianUnionPrimary 435.6 12 DelicesPrimaryschool 434.5 2 ConventPreparatory 432.4 48 WarnerPrimary 429.6 3 BereanChristianAcademy 429.1 5 DublancPrimary 427.5 4 St.MartinPrimary 423.6 90 BellesPrimary 421.5 7