Exploring Dust Storm Effects at Syrtis and Jezero
This research delves into the impact of dust storms at Syrtis and Jezero, focusing on the grid configurations, dust lifting phases, and storm evolution. Through detailed analysis of different phases, such as dust lifting and decaying, the study sheds light on the self-organizing nature of dust storms and their settling patterns. Vertical structures of the systems during key phases are examined to provide a comprehensive understanding of dust storm dynamics.
Download Presentation

Please find below an Image/Link to download the presentation.
The content on the website is provided AS IS for your information and personal use only. It may not be sold, licensed, or shared on other websites without obtaining consent from the author. Download presentation by click this link. If you encounter any issues during the download, it is possible that the publisher has removed the file from their server.
E N D
Presentation Transcript
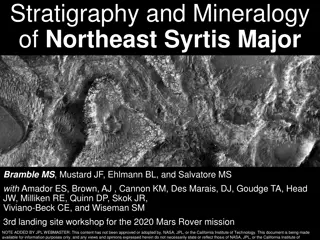
Dust Storm Effects at Syrtis and Jezero Scot Rafkin Jorge Pla-Garcia
Syrtis and Jezero Very similar grid configurations and results Will analyze only Jezero for illustrative purposes Both data sets are available for the project Comparison of simulations with radiatively active lifted dust and no (passive) dust Simulation starts at ~19 UTC = ~ 0000 local Dust lifting starts at ~16 UTC = ~2100 local Almost one full diurnal cycle without dust Phases sol1: spin-up; sol2: dust lifting start sol3: dust lifting mature; sol4: dust decaying Analysis primarily on Grid 3 (~26.7 km spacing) Finer grids are mostly or wholly within storm Grid 3 has locations inside and outside Analysis through mature phase of storm (sol3) and decaying (sol4). 2
Evolution Through Afternoon of sol3 (dust lifting) 4
Evolution Through Afternoon of sol3 (dust lifting) Dust storm self-organize diagonally. Dust slowly settled down 5
Evolution Through Afternoon of sol4 (dust decaying) 7
Evolution Through Afternoon of sol4 (dust decaying) Dust slowly settled down 8
Vertical Structure of Central-East System (Slice along X=79) of sol3 (dust lifting) 9
Vertical Structure of Central-East System (Slice along X=79) of sol4 (dust decaying) 10
Profiles at Near Landing Time (y=15->y=65) of sol3 (dust lifting) High dust load lower layers Near isothermal in lower layers Large spatial variability on winds 11
Profiles at Near Landing Time (y=15->y=65) of sol4 (dust decaying) Lower dust load in lower layers Near isothermal Large spatial variability on winds 12
Profiles without Dust Lifting Nearly uniform temperatures across cross-section. Winds change methodically, especially aloft, along cross-section. Much less variability than with dust. 13
Profiles Bounding Landing in Time of sol3 (dust lifting) More stable than the non dusty case Very strong low level jet Concentration of dust close to surface while lifting 14
Profiles Bounding Landing in Time of sol4 (dust decaying) Development of very shallow mixed layer capped by an inversion Decrease of dust at low levels 15
What About Locations Farther From Storm of sol3 (dust lifting)? Overall steeper lapse rate Large difference in winds compared to non dusty case 16
What About Locations Farther From Storm of sol4 (dust decaying)? Overall steeper lapse rate Large difference in winds compared to non dusty case 17
