Understanding Bathymetric Profiles Using Contour Maps
Learn how to create a bathymetric profile from a contour map of East Flower Garden Bank. By following specific steps and using graph paper, you can analyze the steepness of underwater features such as the bank, distinguishing between gentle and steep slopes based on contour lines' spacing and depths. Through visual representation, you'll grasp the underwater topography and understand how to interpret bathymetric profiles effectively.

Download Presentation

Please find below an Image/Link to download the presentation.
The content on the website is provided AS IS for your information and personal use only. It may not be sold, licensed, or shared on other websites without obtaining consent from the author. Download presentation by click this link. If you encounter any issues during the download, it is possible that the publisher has removed the file from their server.
E N D
Presentation Transcript
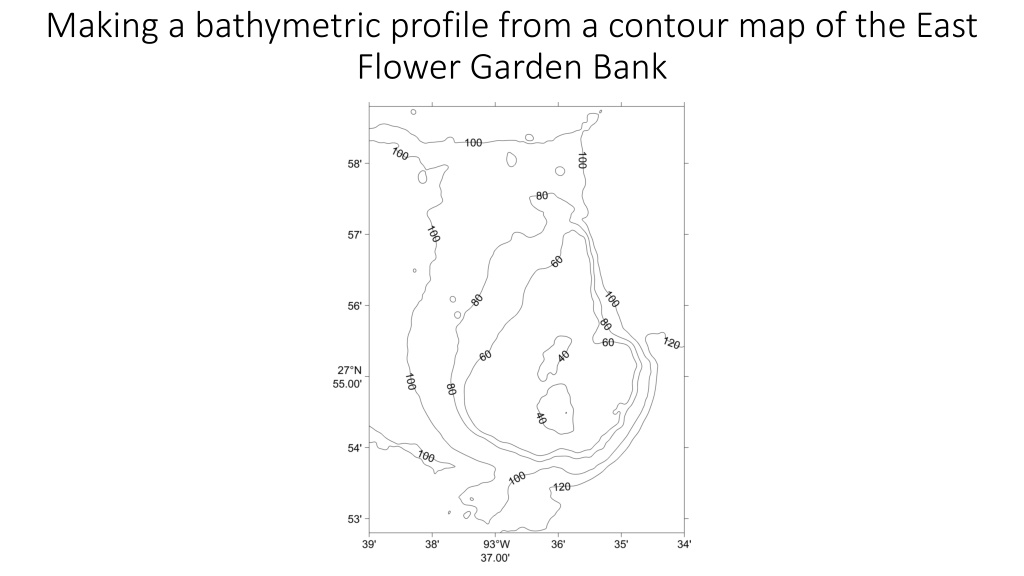
Making a bathymetric profile from a contour map of the East Flower Garden Bank
Lets make a topographic profile from A to C, passing through the top of the bank at B. It will help us see how steep the East Flower Garden Bank is along that line A To make a topographic profile you will need: 1. A copy of the map 2. A piece of graph paper 3. A pencil B Note that the depths along line ABC go from shallower than 40 m to deeper than 120 m C
Since the depths go from less than 40 m to greater than 120 m let s set up our graph paper for one contour line on either side of this range. The contour interval is 20m, so the graph paper should be set up for 20 to 140 m. Always use graph paper as a tool, so choose each square as a value that you can mentally count, i.e. 2, 5, 10, 50, 100, etc. In this case 5 m will most effectively show the change in depth. So let every two squares equal 10 m change in depth
Once you have marked the depths on the graph paper you are ready to make your profile. 20 30 40 50 60 70 80 90 100 110 120 130 140
1. 2. 3. Position your graph paper as shown with the top on the ABC line. Mark A, B and C at the top. Fold under the edge of the graph paper so the line labelled 20 is at the very top. Where each contour line crosses the top of the graph paper, note the depth and put a dot under that point at the appropriate depth. A B C
4. Now connect the dots to see what the bathymetry looks like. A B C The summit is shallower than 40m, but not as shallow as 20m. If it were shallower than 20m the ABC line would have crossed a 20m contour line A is deeper than 100 m, but not as deep as 120m. C is deeper than 120 m, but not as deep as 140m. Which side of the bank is steeper, the AB section or the BC section?
Now you should be able to determine steep and gentle slopes on contour maps by the spacing of the contour lines A B C A When lines are far apart there is a gentle slope B A is deeper than 100 m, but not as deep as 120m. The slopes on bathymetric profiles are exaggerated, because different scales are used in the horizontal and the vertical. So although BC is steeper than AB, it is not nearly as steep as it looks. C A
A B C A B C
The arrow = 1 minute of latitude = 1 nautical mile = 1852 m A B C This is what the profile would look like without vertical exaggeration A B A is deeper than 100 m, but not as deep as 120m. C The same distance in the vertical = 30 m Practically this means that the topography has been stretched in the vertical direction, to assist you in seeing the differences in the seafloor. A
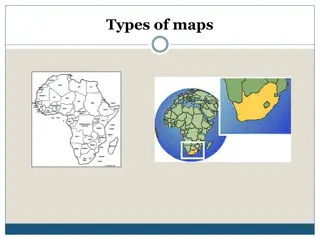
Color contour maps help visualize seabed features You must read the scale to interpret the map!