Understanding UV-Visible Spectrophotometry for Quantitative Analysis
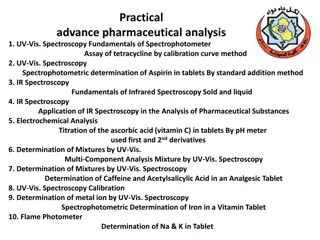
Spectrometry in quantitative analysis involves determining substance concentration through spectrophotometry. UV-Visible Spectrophotometry measures light absorption in the UV or visible region using the Beer-Lambert Law, relating absorbance to substance concentration. The electromagnetic spectrum encompasses various types of radiation, with the UV region being more energetic than visible light. Quantitative analysis utilizes calibration curves to determine unknown sample concentrations based on absorbance measurements.
Download Presentation

Please find below an Image/Link to download the presentation.
The content on the website is provided AS IS for your information and personal use only. It may not be sold, licensed, or shared on other websites without obtaining consent from the author. Download presentation by click this link. If you encounter any issues during the download, it is possible that the publisher has removed the file from their server.
E N D
Presentation Transcript
Quantitative analysis using spectrometry involves determining the concentration of a substance intensity of a specific signal or response from the spectrometer. UV-Visible Spectrophotometry Principle: Measures the absorption of light in the ultraviolet (UV) or visible region by a sample. Quantitative Analysis: Beer-Lambert Law relates the absorbance of light to the concentration of the absorbing substance. in a sample by measuring the
The electromagnetic (EM) spectrum is the range of all types of EM radiation. Radio waves, microwaves, infrared, visible light, ultraviolet, X-rays, and gamma rays
The UV region typically covers the wavelength range of 100 to 400 nanometers (nm). UV light is more energetic than visible light, and electronic transitions in the UV region are associated with changes in the electronic energy levels of the molecules. The visible region spans the wavelength range of 400 to 700 nm. The colors we perceive are a result of the absorption and reflection of certain wavelengths of visible light by substances
The quantitative spectrophotometry. It states that the absorbance (A) of a sample is directly proportional to its concentration (c) and the path length (l) of the sample cell: A = cl where is the molar absorptivity (or molar extinction coefficient) at a specific wavelength. Beer-Lambert Law is fundamental in to analysis UV-Visible
To perform quantitative analysis, a calibration curve measuring solutions specific wavelength. The relationship between absorbance and concentration is then used to determine the concentration of an unknown sample. is often the with prepared. absorbance known This of involves standard at concentrations a
The slope (m) of the line corresponds to l, so you can determine the molar absorptivity ( ) by dividing the slope by the path length (l). y=mx+b
UV-Visible spectrophotometry UV-Visible analytical technique that involves measuring the absorption of ultraviolet (UV) or visible light by a sample. quantitative analysis in various fields, including chemistry, science. spectrophotometry is a common This method is widely used for biochemistry, and environmental
Absorbance Definition a unitless measure of the amount of light absorbed by a sample. It is calculated using the formula: A= log10(T) where T is the transmittance (the fraction of incident light transmitted through the sample). Transmittance (%T): Absorbance (A) Definition: Absorbance, often denoted as "A," is (A): : Definition: Transmittance, denoted as "%T," represents the percentage of incident light that passes through a sample. It is calculated using the formula:
Prepare Prepare Standard Standard Solutions Solutions: 1. Create a series of standard solutions with known concentrations of the substance of interest. These concentrations should cover the expected range of concentrations in your samples. 2. . Measure Measure the absorbance of each standard solution at a specific wavelength using a spectrophotometer. The chosen wavelength should correspond to the absorption maximum of the substance. 1. Measure Absorbance Absorbance: :
3.Plot the Calibration Curve: Plot a graph with absorbance on the y-axis and concentration on the x-axis. Each point on the graph represents the absorbance of a standard solution at a specific concentration. 4.Determine the Molar Absorptivity 5.Quantitative Analysis: Use the calibration curve to determine the concentration of an unknown sample by measuring its absorbance and applying the equation derived from the linear regression.
1- Prepare a stock solution for the stander 2-Reduce solution to four solutions 3- measure the absorbance of each of the four solutions 4- extract the slope value from graph 5- solution of unknown concentration 6- Lambert s law the concentration of the stock measure the absorbance value of the calculate the concentration from Beer-


