Understanding UV/Visible Spectroscopy and Electromagnetic Radiation

Spectroscopy is the study of the interaction of matter with light, specifically UV and visible radiation. Electromagnetic radiation, consisting of photons, transmits energy through space as waves with oscillating electric and magnetic fields. The relationship between wavelength and frequency is key, defining the electromagnetic spectrum from UV to visible light, each with specific regions like violet, yellow, and red. Different wavelengths correspond to different colors, enabling analysis and characterization of substances through spectroscopy techniques.

Download Presentation

Please find below an Image/Link to download the presentation.
The content on the website is provided AS IS for your information and personal use only. It may not be sold, licensed, or shared on other websites without obtaining consent from the author. Download presentation by click this link. If you encounter any issues during the download, it is possible that the publisher has removed the file from their server.
E N D
Presentation Transcript
UV / VISIBLE SPECTROSCOPY Mr. Santosh L. Kumbhare Assistant Professor Shri Shivaji Science & Arts college, Chikhli Dist. - Buldana
Spectroscopy It is the branch of science that deals with the study of interaction of matter with light. OR It is the branch of science that deals with the study of interaction radiation with matter. of electromagnetic
Electromagnetic Radiation
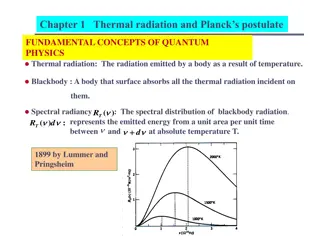
Electromagnetic radiation is the energy transmitted through the space in the form of waves Electromagnetic radiation consist of discrete packages of energy which are called as photons. Electromagnetic radiation consists of an oscillating electric field (E) & an oscillating magnetic field (M) which are perpendicular to each other.
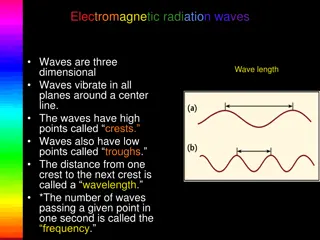
Electromagnetic Radiation Frequency ( ): It is defined as the number of times electrical field radiation oscillates in one second. The unit for frequency is Hertz (Hz). 1 Hz = 1 cycle per second Wavelength ( ): It is the distance between two nearest parts of the wave in the same phase i.e. distance between two nearest crest or troughs.
Electromagnetic Radiation The relationship between wavelength & frequency can be written as: c = As photon is subjected to energy, so E = h = h c /
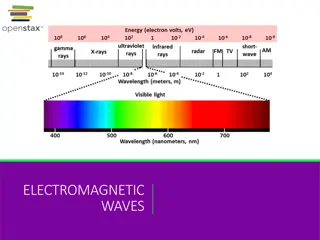
Electromagnetic Radiation Electromagnetic radiations arrange according to decreasing frequency and increasing wavelength gives electromagnetic spectrum
UV radiation region extends from 10nm to 400nm Visible region extends from 400nm to 800nm
Visible Radiation Violet 400 - 420 nm Yellow 570 - 585 nm Indigo 420 - 440 nm Orange 585 - 620 nm Blue 440 - 490 nm Red 620 - 780 nm Green 490 - 570 nm
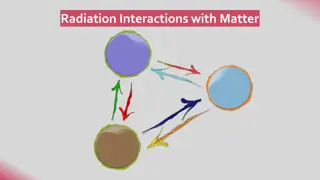
Interaction of EMR with Matter
Interaction of UV Visible Radiation with matter 1. Electronic Energy Levels: At room temperature the molecules are in the lowest energy levels E0. When the molecules absorb UV-visible light from EMR, one of the outermost bond / lone pair electron is promoted to higher energy state such as E1, E2, En, etc is called as electronic transition and the difference is as: E = h = En - E0 where (n = 1, 2, 3, etc) E = 35 to 71 kcal/mole
Lamberts Law
Lamberts Law When a monochromatic radiation is passed through a solution, the decrease in the intensity of radiation with thickness of the solution is directly proportional to the intensity of the incident light. Let I be the intensity of incident radiation. x be the thickness of the solution. Then
Lamberts Law dI I dx dI= So, KI dx Integrate equation between limit I = Io at x = 0 and I = I at x=l, We get, I ln = Kl I 0
Lamberts Law I = 2 303 . log Kl I 0 I K 303 . 2 = log l I 0 I = log 0 A Where, Absorbance I K 303 = E Absorption coefficient . 2 = . A E l Lambert s Law
Beers Law
Beers Law When a monochromatic radiation is passed through a solution, the decrease in the intensity of radiation with thickness of the solution is directly proportional to the intensity of the incident light as well as concentration of the solution. Let I be the intensity of incident radiation. x be the thickness of the solution. C be the concentration of the solution. Then
Beers Law dI . C I dx dI = So, ' . K C I dx Integrate equation between limit I = Io at x = 0 and I = I at x=l, We get, I = ln ' . K C l I 0
Beers Law I 0= . 2 303 log C . . K l I I K 303 0= log . C l . 2 I I = log 0 A Where, Absorbance I K 303 = Molar extinction coefficient = E . 2 C . . A E l Beer s Law
Beers Law = C . . A E l I I T = = = log log T A OR 0 I I 0 From the equation it is seen that the absorbance which is also called as optical density (OD) of a solution in a container of fixed path length is directly proportional to the concentration of a solution.
Electronic Transitions
The graphically shown as: possible electronic transitions can
The possible electronic transitions are * transition 1 2 * transition n * transition 3 n * transition 4 * transition 5 * transition 6
* transition 1 electron from orbital is excited to corresponding anti-bonding orbital *. The energy required is large for this transition. e.g. Methane (CH4) has C-H bond only and can undergo * transition and shows absorbance maxima at 125 nm.
2 * transition electron in a bonding orbital is excited to corresponding anti-bonding orbital *. Compounds containing multiple bonds like alkenes, alkynes, carbonyl, nitriles, aromatic compounds, etc undergo * transitions. e.g. Alkenes generally absorb in the region 170 to 205 nm.
n * transition 3 Saturated compounds containing atoms with lone pair of electrons like O, N, S and halogens are capable of n * transition. These transitions usually requires less energy than * transitions. The number of organic functional groups with n * peaks in UV region is small (150 250 nm).
n * transition 4 An electron from non-bonding orbital is promoted to anti-bonding * orbital. Compounds involving hetero atoms (C=O, C N, N=O) undergo such transitions. containing double bond n * transitions require minimum energy and show absorption at longer wavelength around 300 nm.
* transition 5 & * transition 6 These electronic transitions are forbidden transitions & are only theoretically possible. Thus, n * & * electronic transitions show absorption in region above 200 nm which is accessible spectrophotometer. to UV-visible The UV spectrum is of only a few broad of absorption.
Terms used in UV / Visible Spectroscopy
Chromophore The part of a molecule responsible for imparting color, are called as chromospheres. OR The functional groups containing multiple bonds capable of absorbing radiations above 200 nm due to n * & * transitions. e.g. NO2, N=O, C=O, C=N, C N, C=C, C=S, etc
Chromophore To interpretate UV visible spectrum following points should be noted: 1. Non-conjugated alkenes show an intense absorption below 200 nm & are therefore inaccessible to UV spectrophotometer. 2. Non-conjugated carbonyl group compound give a weak absorption band in the 200 - 300 nm region.
Chromophore e.g. C CH3 O Acetone which has max = 279 nm O H3 C and that cyclohexane has max = 291 nm. compound max is shifted to longer wavelength. e.g. 1,5 - hexadiene has max = 178 nm 2,4 - hexadiene has max = 227 nm When double bonds are conjugated in a CH2 CH3 H2 C H3 C
Chromophore 3. Conjugation of C=C and carbonyl group shifts the max of both groups to longer wavelength. e.g. Ethylene has max = 171 nm Acetone has max = 279 nm Crotonaldehyde has max = 290 nm O C H2 C CH2 H3 C CH3 O C H2 C CH3
Auxochrome The chromophore which modifies the ability of the chromophore to absorb light , altering the wavelength or intensity of absorption. OR The functional group with non-bonding electrons that does not absorb radiation in near UV region but when attached to a chromophore alters the wavelength & intensity of absorption. functional groups attached to a
Auxochrome e.g. Benzene max = 255 nm OH Phenol max = 270 nm NH2 Aniline max = 280 nm
Absorption & Intensity Shifts
1 Bathochromic Shift (Red Shift) When compound shifts to longer wavelength, it is known as bathochromic shift or red shift. absorption maxima ( max) of a The effect is due to presence of an auxochrome or by the change of solvent. e.g. An auxochrome group like OH, -OCH3 causes absorption of compound at longer wavelength.
1 Bathochromic Shift (Red Shift) In alkaline medium, p-nitrophenol shows red shift. Because negatively charged oxygen delocalizes more effectively than the unshared pair of electron. N+O- N+O- O O OH- Alkaline medium O- OH p-nitrophenol max = 255 nm max = 265 nm
2 Hypsochromic Shift (Blue Shift) When compound shifts to shorter wavelength, it is known as hypsochromic shift or blue shift. absorption maxima ( max) of a The effect is due to presence of an group causes removal of conjugation or by the change of solvent.
2 Hypsochromic Shift (Blue Shift) Aniline shows blue shift in acidic medium, it loses conjugation. +Cl- NH2 NH3 H+ Acidic medium Aniline max = 280 nm max = 265 nm
3 Hyperchromic Effect When absorption intensity ( ) of a compound is increased, it is known as hyperchromic shift. If auxochrome introduces to the compound, the intensity of absorption increases. N CH3 N Pyridine max = 257 nm = 2750 2-methyl pyridine max = 260 nm = 3560
4 Hypochromic Effect When absorption intensity ( ) of a compound is decreased, it is known as hypochromic shift. CH3 Naphthalene = 19000 2-methyl naphthalene = 10250
Shifts and Effects Hyperchromic shift Red shift Blue shift Absorbance ( A ) Hypochromic shift max Wavelength ( )
APPLICATIONSOF UV / VISIBLE SPECTROSCOPY
Applications Qualitative & Quantitative Analysis: It is used for characterizing aromatic compounds and conjugated olefins. It can be used to find out molar concentration of the solute under study. Detection of impurities: It is one of the important method to detect impurities in organic solvents. Detection of isomers are possible. Determination of molecular weight using Beer s law.
Reference Books Introduction to Spectroscopy Donald A. Pavia Elementary Organic Spectroscopy Y. R. Sharma Physical Chemistry Puri, Sharma & Pathaniya