Exploring Photosynthesis: A Quantitative Analysis Vignette for Biology Students
Delve into the world of photosynthesis with an engaging vignette designed to enhance quantitative literacy skills in biology students. The focus is on understanding the relationship between carbon fixation, plant biomass, and forests as carbon sinks. Through interactive learning goals and objectives, students will develop graphing, data analysis, and hypothesis testing skills while exploring the scientific concept of photosynthesis and its significance in the natural world.

Uploaded on Sep 30, 2024 | 0 Views
Download Presentation

Please find below an Image/Link to download the presentation.
The content on the website is provided AS IS for your information and personal use only. It may not be sold, licensed, or shared on other websites without obtaining consent from the author. Download presentation by click this link. If you encounter any issues during the download, it is possible that the publisher has removed the file from their server.
E N D
Presentation Transcript
Suck It Up! Understanding photosynthesis through quantitative analysis Regional SI vignette by BIOLOGY-MATH GROUP Barbara Kunkel, John Majors, Eleanor Pardini Washington University in St. Louis Rachelle Spell and Lynn Zimmerman Emory University With thanks to our facilitator Peggy Brickman!
Context Introductory Biology, 100 freshmen Background: Students will have already been exposed to biomolecules (e.g. carbohydrates cellulose). cellular respiration Basic graphing and data analysis skills (in/dependent variables, types of graphs, etc.)
Overall Learning Goals Quantitative literacy skills: Develop quantitative skills to interpret biological data Biology content example = Photosynthesis: Apply relationship of carbon fixation and plant biomass to idea of forests serving as carbon sinks
Quantitative Literacy Learning Objectives for Course 1. Perform simple manipulations of numerical data and express data in graphical form 2. Describe and interpret graphs 3. Use numerical evidence to formulate and test hypotheses 4. Present scientific arguments based on numerical evidence Speth et al. 2010 CBE-Life Science Ed.
Clicker question A small acorn grows into a large oak tree. Where does most of the biomass (weight) of the oak tree come from? A. From the natural growth of the tree B. From carbon dioxide in the air and water in the soil C. From water and nutrients that the tree absorbs through its roots D. From sunlight that the tree uses for food
Clicker question A small acorn grows into a large oak tree. Where does most of the biomass (weight) of the oak tree come from? A. From the natural growth of the tree B. From carbon dioxide in the air and water in the soil C. From water and nutrients that the tree absorbs through its roots chosen by most HARVARD GRADUATES (see video on Blackboard) D. From sunlight that the tree uses for food
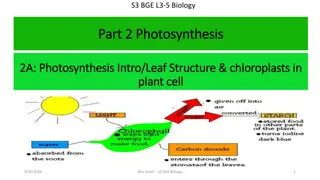
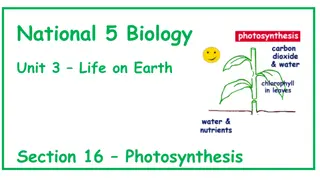
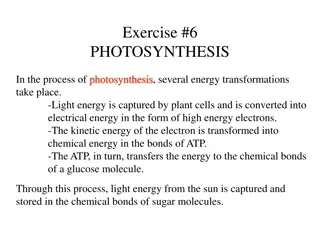
Mini-lecture on photosynthesis 6 CO2 + 12 H2O + light energy C6H12O6 + 6 H2O + 6 O2 Cellulose
How could you measure rate of photosynthesis? 6 CO2 + 12 H2O + light energy C6H12O6 + 6 H2O + 6 O2
Amount of CO2 in chamber Before After
In Class Graphing Activity 1. Talk with your group to decide what type of graph you should use for this data.
Clicker question What type of graph would you use to display this data? Bar graph Pie chart Line graph Scatter plot
Clicker question What type of graph would you use to display this data? Bar graph Pie chart Line graph Scatter plot BEST
In Class Graphing Activity- 5 minutes 2. Label the axes. 3. Draw the graph. Ambient CO2 concentration (ppm) 100 200 300 400 600 800 Mean CO2 assimilation ( mol/m2/second) 50 80 100 110 120 125
In Class Graphing Activity- Sample of Useful Graph Sample Group Graphs
How do you describe the relationship? A. As the CO2 level increases, photosynthetic rate increases B. As the CO2 level increases, photosynthetic rate decreases C. As the photosynthetic rate increases, the CO2 level increases D. As the photosynthetic rate increases, the CO2 level decreases
How do you describe the relationship? A. As the CO2 level increases, photosynthetic rate increases B. As the CO2 level increases, photosynthetic rate decreases C. As the photosynthetic rate increases, the CO2 level increases D. As the photosynthetic rate increases, the CO2 level decreases
Activities with Keeling Curve Class activities or homework as needed for your course 1. Groups plot subsets (n=8) of atmospheric CO2 (Mauna Loa) over time Trend lines, variance, sample size 2. Examine long term and seasonal trends in Mauna Loa data Long term = fossil fuel; seasonal variation = photosynthesis 3. Examine trends at three sites: Mauna Loa Mauna Loa, Barrow, and South Pole. Variation in amplitude of seasonal variation among sites with different amounts of vegetation
Summative assessment see handout 1. skill analysis 2. content analysis
Tips, tricks, and resources Photosynthesis figures: Plant physiology textbook Quantitative literacy problem sets: Intro statistics textbook Personal carbon footprint calculator http://www.nature.org/greenliving/carboncalculator/index.htm Thinking like a scientist resources on Photosynthesis BioDQC.org Quantitative literacy resources at Project-based Applied Learning website (Brickman) Pal.uga.org Scripps CO2 Center http://scrippsco2.ucsd.edu/ Carbon Dioxide Information Analysis Center http://cdiac.ornl.gov/
Learning Objective Assessment Active learning Low Order/ High Order Perform simple manipulations of numerical data and express data in graphical form 1. Clicker ? Graph type choice 2. Graphing activity 3. Exam ? on plotting graph 1. Clicker ? Acorn to oak 2. Graphing activity and clicker ?s 3. Homework on Mauna Loa High Describe and interpret graphs 1. Clicker ? CO2/biomass relationship 2. Mauna Loa graph homework 3. Exam ? on carbon fixation and global warming 1. Clicker ? CO2/biomass relationship 2. Mauna Loa graph homework High Relate carbon fixation to biomass 1. Clicker ? Acorn to oak 2. Graphing activity hypothesis creation 3. Exam ? on carbon fixation and global warming 1. Clicker ? Acorn to oak 2. Graphing activity hypothesis creation 2. Mauna Loa graph homework High Diversity: Audio, visual, kinesthetic learning
Homework: Keeling Curve Charles David Keeling - Scripps Institution of Oceanography, University of California, San Diego, from 1956 until his death in 2005. Charles David Keeling Manometer CO2 extractor
Amount of CO2 in chamber Amount of CO2 in chamber Difference Time