Practical Advances in Pharmaceutical Analysis Using Spectroscopy Techniques
This comprehensive guide covers various spectroscopy techniques, including UV-Vis and IR spectroscopy, as well as electrochemical analysis and flame photometry, for pharmaceutical analysis. It delves into the fundamentals of molecular spectroscopy, discussing electromagnetic radiation, quantum energy levels, and the principles of molecular spectroscopy. The content includes practical methods for determining substances in pharmaceutical samples, such as tetracycline, aspirin, vitamins, and metal ions. It also explores the quantized energy levels in molecules and the importance of calibration in spectrophotometry.
- Pharmaceutical Analysis
- Spectroscopy Techniques
- UV-Vis Spectroscopy
- IR Spectroscopy
- Molecular Spectroscopy

Download Presentation

Please find below an Image/Link to download the presentation.
The content on the website is provided AS IS for your information and personal use only. It may not be sold, licensed, or shared on other websites without obtaining consent from the author. Download presentation by click this link. If you encounter any issues during the download, it is possible that the publisher has removed the file from their server.
E N D
Presentation Transcript
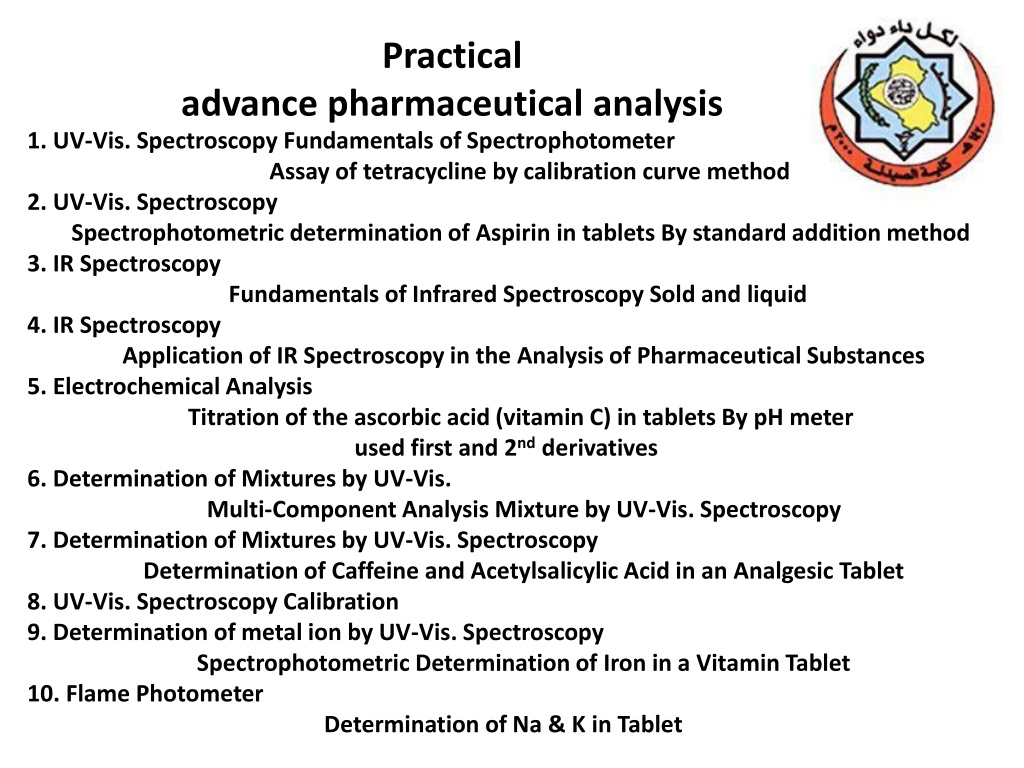
Practical advance pharmaceutical analysis 1. UV-Vis. SpectroscopyFundamentals of Spectrophotometer Assay of tetracycline by calibration curve method 2. UV-Vis. Spectroscopy Spectrophotometric determination of Aspirinin tabletsBy standard addition method 3. IR Spectroscopy Fundamentals of Infrared SpectroscopySold and liquid 4. IR Spectroscopy Application of IR Spectroscopy in the Analysis of Pharmaceutical Substances 5. Electrochemical Analysis Titration of the ascorbic acid (vitamin C) in tablets By pH meter used first and 2nd derivatives 6. Determination of Mixtures by UV-Vis. Multi-Component Analysis Mixture by UV-Vis. Spectroscopy 7. Determination of Mixtures by UV-Vis. Spectroscopy Determination of Caffeine and Acetylsalicylic Acid in an Analgesic Tablet 8. UV-Vis. Spectroscopy Calibration 9. Determination of metal ion by UV-Vis. Spectroscopy Spectrophotometric Determination of Iron in a Vitamin Tablet 10. Flame Photometer Determination of Na & K in Tablet
Principles of molecular spectroscopy Electromagnetic radiation Electromagnetic radiation has the properties of a particle (photon) and a wave. = distance of one wave = frequency: waves per unit time (sec-1, Hz) c = speed of light (3.0 x 10⁸m sec-1) h= Plank s constant (6.63 x 10⁻³⁴J sec) 2
Quantum: the energy of a photon E = h c = n E = h c/ E E -rays x-rays Vis IR microwaves radiowaves UV 10-5 10-10 10-8 10-6 10-4 10-2 108 (cm) 1 Wavelength ( ) Frequency ( ) Energy (E) short high high long low low 3
Principles of molecular spectroscopy Quantized Energy Levels molecules have discrete energy levels (no continuum between levels) A molecule absorbs electromagnetic radiation when the energy of photon corresponds to the difference in energy between two states 4
organic molecule (ground state) light organic molecule (excited state) relaxation organic molecule (ground state) + h h UV-Vis: valance electron transitions - gives information about -bonds and conjugated systems in organic compounds Infrared: molecular vibrations (stretches, bends) - identify functional groups Radio waves: nuclear spin in a magnetic field (NMR) - gives a map of the H and C framework 5
Calibration a process that relates the measured analytical signal to the concentration of analyte (the substance to be analyzed). Spectrophotometer: It is a technique that uses the absorbance of light by an analyte at a certain wavelength to determine the analyte concentration (or transmittance of light). Wavelength, nm 400-430 430-480 480-490 490-500 500-550 550-575 575-590 590-625 630-700 Color Violet Blue Green-blue Blue-green Green Yellow-green Yellow Orange Red Complementary color Yellow-green Yellow Orange Red Purple Violet Blue Green-blue Blue-green Table: Correlation between wavelength, color, and complementary color
When we see an object as purple, in fact it absorbs light in the green region of the spectrum: only blue and red wavelengths reach the eye Solution absorbs red appears blue-green Solution absorbs blue-green appears red Beer s law A = E E l C A absorbance of compound is called the Molar Absorptivity absorption factor of the compound, it is a function of wavelength specific for each molecule, with the path-length (l) normally given in cm C in Molarity units, mol/L has the units L.mol 1cm 1, if alternatively C is in mol/L then will have the units cm2mol 1 A= - log T , T% = T x 100 T = ( I/I0) Intensity of light
The blank solution Solution contains all of the components of the original sample except for the analyte. The absorption spectrum A graph between absorbance of the analyte versus the change in the wavelength. from absorption spectrum we find the wavelength with the highest absorbance, the wavelength of the absorption peak ( max), at this wavelength the spectrophotometric method is most sensitive for the analyte. (ferrozine)3Fe(II) complex max = 562 nm
The calibration curve A graph between absorbance versus analyte concentration in standard solutions, at the wavelength of the absorption peak ( max). From calibration curve, can be used to find the concentration of an unknown.
Assay of tetracycline by calibration curve method Absorbance (A) Vol. of (0.1%) FeCl3 Soln. (mL) Vol. of (0.01N) HCl Soln. (mL) Concentration (mg/L) Type of Soln. Vol. of stock Soln. (mL) Blank 0 1 2 3 4 0 5 5 5 5 5 5 5 4 3 2 1 0 No.1 No. 2 No. 3 No. 4 Unknown 5mL
Measuring the absorption spectrum and determining max This part of the experiment each pair of students should record all absorbance at each wavelength and draw the absorption spectrum. Rinse one of the cuvettes with blank solution, put the cuvette in the sample compartment, this is the reference solution, set the wavelength to 350 nm, then set the Absorbance to zero. Rinse a second cuvette standard solution No.4, place the cell in the sample compartment, measure the Absorbance at 350 nm and record in your notebook. Repeat this procedure (steps 1 and 2 above) for the two cuvettes at wavelengths 360,370, 380, 390, 400, 420, --.600 nm, first setting A = 0 for the cuvette with blank, then measuring A for the cuvette with solution No.4, recording the absorbance at each wavelength, record in data table (at absorbance begin larger reduce wavelength intervals to 5nm). Prepare a graph of absorbance (A) vs. wavelength ( ) and determine max (maximum wavelength). Attach this graph to the lab report, (Plotting Use the program Excel to plot the absorption spectrum and determining max).
The calibration curve This part of the experiment must be done by each pair of students separately. Set the wavelength at ( max), place the cuvette with blank in the cell compartment and again set the Absorbance to zero. Measure and record the Absorbance of each of the four standard solutions & unknown, starting with the most dilute standard, after each measurement, rinse the cuvette with the next standard, not with blank! Draw a plot having X-axis as concentration (mg/L) and Y-axis as Absorbance at max (Plotting Use the program Excel to plot the calibration curve). Use Beer s law to calculate for TC, given the cell width (path length l) to be 1 cm. Use calibration curve to calculate concentration of unknown solution. Find application for calibration curve equation, to calculate concentration of unknown solution?
Spectrophotometric determination of Aspirinin tablets By standard addition method For good analysis the sample must have these properties: (1) Stability in solution. (2) Adherence to Beer's law. (3) Large molar absorptive ( ). (4) Sufficient separation of the desired analyte absorbance wavelength from interfering substances. If Not, the substance is usually converted into a new species suitable for quantitative spectroscopy. SAMPLE + CHROMOGENIC REAGENT UV-VIS ABSORBING PRODUCT Direct calibration curve method can be applied for analyzing unknown sample only and only if the standard solutions and the unknown solution are prepared and measured under exactly the same conditions matrix effects everything except the analyte, contributes significantly to the absorbance of a sample and is also highly variable. The method that can be used to improve results is the method of standard additions, the basic idea is to add standard to the analyte sample so that the standard is subjected to the same matrix effects as the analyte.
Aspirin sample Accurately record the weight of a group of ten aspirin tablets so that you can determine an average tablet weight, use a mortar and pestle to crush enough tablets to produce an average (g) tablet powder, using a clean dry weighing bottle (beaker or conical flask), add 20 mL of ethanol (measure by graduated cylinder), swirl gently to dissolve. (Aspirin is not very soluble in water, ethanol helps the aspirin dissolve). Note that an aspirin tablet contains other compounds in addition to aspirin, some of these are not very soluble, and the solution will be cloudy due to insoluble components of the tablet. Add 75mL of NaOH (0.1N) than heat in a water bath to speed up the hydrolysis reaction, avoid boiling, because the sample may decompose, while heating, swirl the beaker occasionally, after 15 minutes, remove sample from the water bath and cool for 5 minutes, than filtered the solution.
Preparing the stock solution and standard solutions: Stock solution of sodium salicylate: Weighta 0.3 g of sodium salicylate in beaker, dissolve the solid by the addition of D.W., than transfer to volumetric flask (1L), and continue adding D.W. to the mark on the volumetric flask. Ferric Nitrate: Dissolve 1.0 g ferric nitrate in 99 mL of water to make a 1% solution of ferric nitrate, (Total volume =100 mL of 1% ferric nitrate),(use2g of Fe2(SO4)3 in 200 mL) Nitric Acid 1: Prepare 100 mL of 0.07 M nitric acid, ( 2.5mL of HNO3 WT.%=65, D=1.4Kg/L, in 500 mL) Standard solution: Transfer 5.00 mL of stock solution to a volumetric flask (25mL), than dilute with D.W. to mark (Its concentration is mg/L). Dilute Ferric Nitrate: Mix 5 mL of 1% ferric nitrate with 4 mL of 0.07 M HNO3 (nitric acid 1) and label the container dilute ferric nitrate. Unknown solution: Transfer 5.00 mL of Aspirin sample solution to a volumetric flask (10mL), than dilute with D.W.
Procedure for spectrophotometer instrument in the visible range 1. Turn on the instrument and allow it to warm up for about 10 min. 2. Set the wavelength to max nm.? 3. Depress the mode control key and set the mode to Absorbance. 4. Fill seven volumetric flask (5.0mL) with varying amounts of solution and adjust the volumes of each to 5.0 mL by D.W. as shown in Table 1 below ( only blank in 10mL volumetric flask) Sample Standard ( ..mg/L) 0.0 0.0 0.2 0.4 0.6 0.8 1.0 Dilute Unknown Absorbance Concentration mg/L 0.0 0.0 Ferric Nitrate 1.0 1.0 1.0 1.0 1.0 1.0 1.0 Blank 0.0 1.0 1.0 1.0 1.0 1.0 1.0 0.0 # 1 # 2 # 3 # 4 # 5 # 6
5. Set the wavelength to 400 nm, zero absorbance will be determined with the blank solution cuvette, Replace the blank cuvette with the sample and determine absorbance for solution, Repeat this procedure (420, 440 --.600 nm) (at absorbance begin larger reduce wavelength intervals to 5nm), determine max. 6. Replace the blank cuvette with each of the numbered samples and determine absorbance for each solution, carefully record the A vs concentration at max. 7. Draw a plot having X-axis as concentration (mg/L) and Y-axis as Absorbance at max (Plotting Use the program Excel to plot the calibration curve). Use Beer s law to calculate for sodium salicylate, given the cell width (path length l cm), Use the curve to calculate concentration of unknown solution.


")