Understanding Hypothesis Testing in Statistics
This content explores the concept of hypothesis testing in statistics, covering the procedures, general research questions, examples, and hypothesis design. It explains the formulation of hypotheses, decision criteria, significance levels, and the importance of testing population parameters. Various scenarios and questions are provided to aid in understanding the practical application of hypothesis testing.

Download Presentation

Please find below an Image/Link to download the presentation.
The content on the website is provided AS IS for your information and personal use only. It may not be sold, licensed, or shared on other websites without obtaining consent from the author. Download presentation by click this link. If you encounter any issues during the download, it is possible that the publisher has removed the file from their server.
E N D
Presentation Transcript
Inferential Statistics and Probability a Holistic Approach Chapter 9 One Population Hypothesis Testing Creative Commons License This Course Material by Maurice Geraghty is licensed under a Creative Commons Attribution-ShareAlike 4.0 International License. Conditions for use are shown here: https://creativecommons.org/licenses/by-sa/4.0/ 1
General Research Question Decide on a topic or phenomena that you want to research. Formulate general research questions based on the topic. Example: Topic: Health Care Reform Some General Questions: Would a Single Payer Plan be less expensive than Private Insurance? Do HMOs provide the same quality care as PPOs? Would the public support mandated health coverage? 4
9-13 EXAMPLE General Question A food company has a policy that the stated contents of a product match the actual results. A General Question might be Does the stated net weight of a food product match (on average) the actual weight? The quality control statistician could then decide to test various food products for accuracy. 5
Hypothesis Testing Design State Your Hypotheses Null Hypothesis Alternative Hypothesis Determine Appropriate Model Test Statistic One or Two Tailed Determine Decision Criteria Significance Level and Power Analysis 7
9-3 What is a Hypothesis? Hypothesis: A statement about the value of a population parameter developed for the purpose of testing. Examples of hypotheses made about a population parameter are: The mean monthly income for programmers is $9,000. At least twenty percent of all juvenile offenders are caught and sentenced to prison. The standard deviation for an investment portfolio is no more than 10 percent per month. 8
9-4 What is Hypothesis Testing? Hypothesis testing: A procedure, based on sample evidence and probability theory, used to determine whether the hypothesis is a reasonable statement and should not be rejected, or is unreasonable and should be rejected. 9
Hypothesis Testing Design State Your Hypotheses Null Hypothesis Alternative Hypothesis Determine Appropriate Model Test Statistic One or Two Tailed Determine Decision Criteria Significance Level and Power Analysis 10
9-6 Definitions Null Hypothesis H0: A statement about the value of a population parameter that is assumed to be true for the purpose of testing. Alternative Hypothesis Ha: A statement about the value of a population parameter that is assumed to be true if the Null Hypothesis is rejected during testing. 11
9-3 Hypotheses written in words and population parameters Ho: The mean monthly income for programmers is $9,000. Ha: The mean monthly income for programmers is not $9,000. : 9000 Ho Ha = : 9000 Ho: At least 20% of all juvenile offenders sentenced to prison. Ha: Less than 20% of all juvenile offenders sentenced to prison. : 0.20 : 0.20 Ho p Ha p Ho: The standard deviation for an investment portfolio is no more than 10 percent per month. Ha: The standard deviation for an investment portfolio is more than 10 percent per month. : 10 Ho Ha : 10 12
9-13 EXAMPLE Stating Hypotheses A food company has a policy that the stated contents of a product match the actual results. The quality control statistician decides to test the claim that a 16 ounce bottle of Soy sauce contains on average 16 ounces. Ho: The mean amount of Soy Sauce is 16 ounces Ha: The mean amount of Soy Sauce is not 16 ounces. Ho: =16 Ha: 16 13
Hypothesis Testing Design State Your Hypotheses Null Hypothesis Alternative Hypothesis Determine Appropriate Model Test Statistic One or Two Tailed Determine Decision Criteria Significance Level and Power Analysis 14
9-7 Definitions Statistical Model: A mathematical model that describes the behavior of the data being tested. Normal Family = the Standard Normal Distribution (Z) and functions of independent Standard Normal Distributions (eg: t, 2, F). Most Statistical Models will be from the Normal Family due to the Central Limit Theorem. Model Assumptions: Criteria which must be satisfied to appropriately use a chosen Statistical Model. Test statistic: A value, determined from sample information, used to determine whether or not to reject the null hypothesis. 15
9-13 EXAMPLE Choosing Model The quality control statistician decides to test the claim that a 16 ounce bottle of Soy sauce contains on average 16 ounces. We will assume the population standard is known Ho: =16 Ha: 16 Model: One sample Z test of mean X = 0 Z Test Statistic: n 16
Hypothesis Testing Design State Your Hypotheses Null Hypothesis Alternative Hypothesis Determine Appropriate Model Test Statistic One or Two Tailed Determine Decision Criteria Significance Level and Power Analysis 17
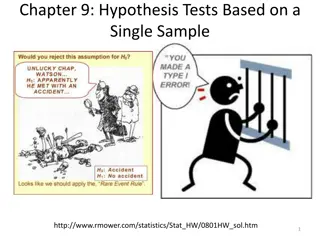
9-6 Definitions Level of Significance: The probability of rejecting the null hypothesis when it is actually true. (signified by ) Type I Error: Rejecting the null hypothesis when it is actually true. Type II Error: Failing to reject the null hypothesis when it is actually false. 18
Outcomes of Hypothesis Testing Fail to Reject Ho Reject Ho Correct Decision Ho is true Type I error Correct Decision Ho is False Type II error 19
9-13 EXAMPLE Type I and Type II Errors Ho: The mean amount of Soy Sauce is 16 ounces Ha: The mean amount of Soy Sauce is not 16 ounces. Type I Error: The researcher supports the claim that the mean amount of soy sauce is not 16 ounces when the actual mean is 16 ounces. The company needlessly fixes a machine that is operating properly. Type II Error: The researcher fails to support the claim that the mean amount of soy sauce is not 16 ounces when the actual mean is not 16 ounces. The company fails to fix a machine that is not operating properly. 20
Hypothesis Testing Design State Your Hypotheses Null Hypothesis Alternative Hypothesis Determine Appropriate Model Test Statistic One or Two Tailed Determine Decision Criteria Significance Level and Power Analysis 21
9-7 Definitions Critical value(s): The dividing point(s) between the region where the null hypothesis is rejected and the region where it is not rejected. The critical value determines the decision rule. Rejection Region: Region(s) of the Statistical Model which contain the values of the Test Statistic where the Null Hypothesis will be rejected. The area of the Rejection Region = 22
9-8 One-Tailed Tests of Significance A test is one-tailed when the alternate hypothesis, Ha , states a direction, such as: H0 : The mean income of females is less than or equal to the mean income of males. Ha : The mean income of females is greater than males. Equality is part of H0 Ha determines which tail to test Ha: > 0 means test upper tail. Ha: 0 means test lower tail. 23
Left-tailed test : H 0 0 : H 0 a = .05 X = 0 Z n 24
Right-tailed test : H 0 0 05 . : H 0 a = X = 0 Z n 25
9-10 Two-Tailed Tests of Significance A test is two-tailed when no direction is specified in the alternate hypothesis Ha , such as: H0 : The mean income of females is equal to the mean income of males. Ha : The mean income of females is not equal to the mean income of the males. Equality is part of H0 Ha determines which tail to test Ha: 0 means test both tails. 26
Two-tailed test 0 : = : H 0 H 0 a = = 05 . 025 . 2 X = 0 Z n 27
Collect and Analyze Experimental Data Collect and Verify Data Conduct Experiment Check for Outliers Determine Test Statistic and/or p-value Compare to Compare to Critical Value Make a Decision about Ho Reject Ho and support Ha Fail to Reject Ho 30
Collect and Analyze Experimental Data Collect and Verify Data Conduct Experiment Check for Outliers Determine Test Statistic and/or p-value Compare to Compare to Critical Value Make a Decision about Ho Reject Ho and support Ha Fail to Reject Ho 31
Outliers An outlier is data point that is far removed from the other entries in the data set. Outliers could be Mistakes made in recording data Data that don t belong in population True rare events 32
Outliers have a dramatic effect on some statistics Example quarterly home sales for 10 realtors: 2 2 3 4 5 5 6 6 7 50 with outlier without outlier Mean Median Std Dev IQR 9.00 5.00 14.51 3.00 4.44 5.00 1.81 3.50 33
Using Box Plot to find outliers The box is the region between the 1st and 3rd quartiles. Possible outliers are more than 1.5 IQR s from the box (inner fence) Probable outliers are more than 3 IQR s from the box (outer fence) In the box plot below, the dotted lines represent the fences that are 1.5 and 3 IQR s from the box. See how the data point 50 is well outside the outer fence and therefore an almost certain outlier. 34
Using Z-score to detect outliers Calculate the mean and standard deviation without the suspected outlier. Calculate the Z-score of the suspected outlier. If the Z-score is more than 3 or less than -3, that data point is a probable outlier. 4 . 4 50 = Z = 25 2 . . 1 81 35
Outliers what to do Remove or not remove, there is no clear answer. For some populations, outliers don t dramatically change the overall statistical analysis. Example: the tallest person in the world will not dramatically change the mean height of 10000 people. However, for some populations, a single outlier will have a dramatic effect on statistical analysis (called Black Swan by Nicholas Taleb) and inferential statistics may be invalid in analyzing these populations. Example: the richest person in the world will dramatically change the mean wealth of 10000 people. 36
Example Analyze Data In the Soy Sauce Example, a 36 bottles were measured, volume is in fluid ounces 14.51 15.16 15.28 15.33 15.36 15.42 15.43 15.45 15.49 15.59 15.60 15.61 15.62 15.63 15.71 15.81 15.87 16.00 16.01 16.02 16.05 16.06 16.06 16.09 16.09 16.11 16.16 16.16 16.27 16.31 16.35 16.36 16.45 16.72 16.75 16.79 37
Example Analyze Data Although 14.51 might be a possible outlier and the data seems negatively skewed, the Central Limit Theorem assures that the sample mean will have a normal distribution 38
Collect and Analyze Experimental Data Collect and Verify Data Conduct Experiment Check for Outliers Determine Test Statistic and/or p-value Compare to Compare to Critical Value Make a Decision about Ho Reject Ho and support Ha Fail to Reject Ho 39
The logic of Hypothesis Testing This is a Proof by contradiction. We assume Ho is true before observing data and design Ha to be the complement of Ho. Observe the data (evidence). How unusual are these data under Ho? If the data are too unusual, we have proven Ho is false: Reject Ho and go with Ha (Strong Statement) If the data are not too unusual, we fail to reject Ho. This proves nothing and we say data are inconclusive. (Weak Statement) We can never prove Ho , only disprove it. Prove in statistics means support with the Alternative Hypothesis. Note: It is never correct to say (1- )100% certain of our decision. (example: if =.05, then we are not 95% certain if we Reject Ho.) 40
Test Statistic Test Statistic: A value calculated from the Data under the appropriate Statistical Model from the Data that can be compared to the Critical Value of the Hypothesis test If the Test Statistic fall in the Rejection Region, Ho is rejected. The Test Statistic will also be used to calculate the p-value as will be defined next. 41
9-12 Example - Testing for the Population Mean Large Sample, Population Standard Deviation Known When testing for the population mean from a large sample and the population standard deviation is known, the test statistic is given by: =X Z / n 42
9-15 p-value in Hypothesis Testing p-Value: the probability, assuming that the null hypothesis is true, of getting a value of the test statistic at least as extreme as the computed value for the test. If the p-value is smaller than the significance level, H0 is rejected. If the p-value is larger than the significance level, H0 is not rejected. 43
Comparing p-value to Both p-value and are probabilities. The p-value is determined by the data, and is the probability of getting results as extreme as the data assuming H0 is true. Small values make one more likely to reject H0. is determined by design, and is the maximum probability the experimenter is willing to accept of rejecting a true H0. Reject H0 if p-value < for ALL MODELS. 44
Graphic where decision is to Reject Ho Ho: = 10 Ha: > 10 Design: Critical Value is determined by significance level Data Analysis: p-value is determined by Test Statistic Test Statistic falls in Rejection Region. p-value (blue) < (purple) Reject Ho. Strong statement: Data supports Alternative Hypothesis. 45
Graphic where decision is Fail to Reject Ho Ho: = 10 Ha: > 10 Design: Critical Value is determined by significance level Data Analysis: p-value is determined by Test Statistic Test Statistic falls in Non-rejection Region. p-value (blue) > (purple) Fail to Reject Ho. Weak statement: Data is inconclusive and does not support Alternative Hypothesis. 46
9-13 EXAMPLE General Question A food company has a policy that the stated contents of a product match the actual results. A General Question might be Does the stated net weight of a food product match the actual weight? The quality control statistician decides to test the 16 ounce bottle of Soy Sauce. 47
EXAMPLE Design Experiment A sample of n=36 bottles will be selected hourly and the contents weighed. Assume = 0.5 Ho: =16 Ha: 16 The Statistical Model will be the one population test of mean using the Z Test Statistic. This model will be appropriate since the sample size insures the sample mean will have a Normal Distribution (Central Limit Theorem) We will choose a significance level of = 5% 48
EXAMPLE Conduct Experiment Last hour a sample of 36 bottles had a mean weight of 15.88 ounces. From past data, assume the population standard deviation is 0.5 ounces. Compute the Test Statistic ] 36 / 5 /[. ] 16 88 . 15 [ = = Z . 1 44 For a two tailed test, The Critical Values are at Z = 1.96 49
Decision Critical Value Method This two-tailed test has two Critical Value and Two Rejection Regions The significance level ( ) must be divided by 2 so that the sum of both purple areas is 0.05 The Test Statistic does not fall in the Rejection Regions. Decision is Fail to Reject Ho. 50