Understanding Hypothesis Testing and Types of Errors in Econometrics
Hypothesis testing is vital in econometrics to evaluate statements about population parameters. The null hypothesis assumes no difference, while the alternative hypothesis offers a different perspective. Different types of errors—such as Type I and Type II errors—can occur during hypothesis testing, influencing the decision to accept or reject the null hypothesis based on sample results.

Download Presentation

Please find below an Image/Link to download the presentation.
The content on the website is provided AS IS for your information and personal use only. It may not be sold, licensed, or shared on other websites without obtaining consent from the author. Download presentation by click this link. If you encounter any issues during the download, it is possible that the publisher has removed the file from their server.
E N D
Presentation Transcript
Binod Goswamis Classes on Econometrics B.A. Fourth Semester Honours Topic- Chi-Square Test Basic Pervious knowledge required on- 1. Hypothesis- Null and Alternative 2. Errors and its types 3. Parametric and Nonparametric Test 4. Nominal and Categorical Variable sample mean x Population mean (parameter ) 9/29/2024 BG's Classes on econometrics 1
Hypothesis- Null and Alternative Hypothesis is a statement about a population.Ex- Mean weight of students of NGC is 46 kg and its standard deviation is 9 It is an assumption made about parameter values. Validity of hypothesis is tested with the help of statistical techniques (CHI-square test, T- test,F-test) These test tells us whether hypothesis is to be accepted or to be rejected 9/29/2024 BG's Classes on econometrics 2
Types of Hypothesis Null hypothesis and Alternative hypothesis Null hypothesis Null hypothesis-a statistical hypothesis stated to test its validity is called null hypothesis. Denoted by H0 H0 is always tested on the basis of sample results and is ultimately either rejected or accepted. It is the hypothesis of no difference. If the population mean is then H0 is written as H0 : = 0 , 0 is a specified value of Similarly if and 1 are 2 the parameters of two populations , the null hypothesis is written as H0 : 1 = 2 9/29/2024 BG's Classes on econometrics 3
Types of Hypothesis Null hypothesis and Alternative hypothesis Alternative hypothesis- hypothesis accepted as a result of rejection of null hypothesis. Denoted as H1 It is complementary to the null hypothesis if the null hypothesis is that the population has specified mean 0 (say) i.e. H0 : = 0 Then the alternative hypothesis may be 1. H1 : 0 2. H1 : > 0 3. H1 : < 0 9/29/2024 BG's Classes on econometrics 4
H1 : 0 Two tailed hypothesis H1 : > 0 One tailed Right tailed H1 : < 0One tailed Left tailed 9/29/2024 BG's Classes on econometrics 5
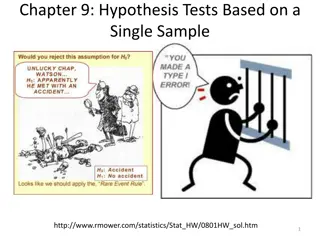
Errors in Hypothesis Testing In hypothesis testing, the decision to accept or reject of null hypothesis is taken on the basis of the sample result. The decision taken in this way may not be correct always. Thus Errors arise. There are 4 possibilities when a statistical hypothesis is tested 9/29/2024 BG's Classes on econometrics 6
Reject H0 when it is actually true Type I error( ) Accept H0 when it is actually false Type II error( ) Accept H0 when it is actually true No error No error Reject H0 when it is actually false 9/29/2024 BG's Classes on econometrics 7
Type I and Type II errors Accept H0 Reject H0 Type I error H0is true No error H0 is false Type II error No error 9/29/2024 BG's Classes on econometrics 8
LEVEL OF SINGNIFICANCE The probability of rejecting a null hypothesis when it is actually true is called the level of significance. It is denoted by . It is written as P(RejectH0 when it is true)= Level of significance is the size of the type I error. 9/29/2024 BG's Classes on econometrics 9
The level of significance generally used in testing of hypothesis are 5% and 1%. The 5% level of significance means that we make wrong decisions only in 5 cases out of 100 cases. In other words , we reject the correct null hypothesis in 5 cases out of 100 cases. Alternatively, we are 95% confident that we have made the right decision in rejecting the null hypothesis and accepting the alternative hypothesis. Similar interpretation may be made for 1% level of sinificance. 9/29/2024 BG's Classes on econometrics 10
DEGRREES OF FREEDOM(d.f.) Degrees of freedom represent the number of independent values in a calculation, minus the number of estimated parameters. For example, the variance of n data points has n-1 d.f. because the variance requires estimating another parameter(the mean) in the calculation. Example sunglass/hat 9/29/2024 BG's Classes on econometrics 11


")