Understanding Hypothesis Testing in Statistics
This content discusses the fundamentals of hypothesis testing based on a single sample in statistics. It covers the assumptions for inference, the parts of a hypothesis test, statistical hypotheses, and provides examples of hypothesis tests and significance tests in practical scenarios. The importance of stating null and alternative hypotheses, testing claims, and making decisions based on data are also emphasized.

Download Presentation

Please find below an Image/Link to download the presentation.
The content on the website is provided AS IS for your information and personal use only. It may not be sold, licensed, or shared on other websites without obtaining consent from the author. Download presentation by click this link. If you encounter any issues during the download, it is possible that the publisher has removed the file from their server.
E N D
Presentation Transcript
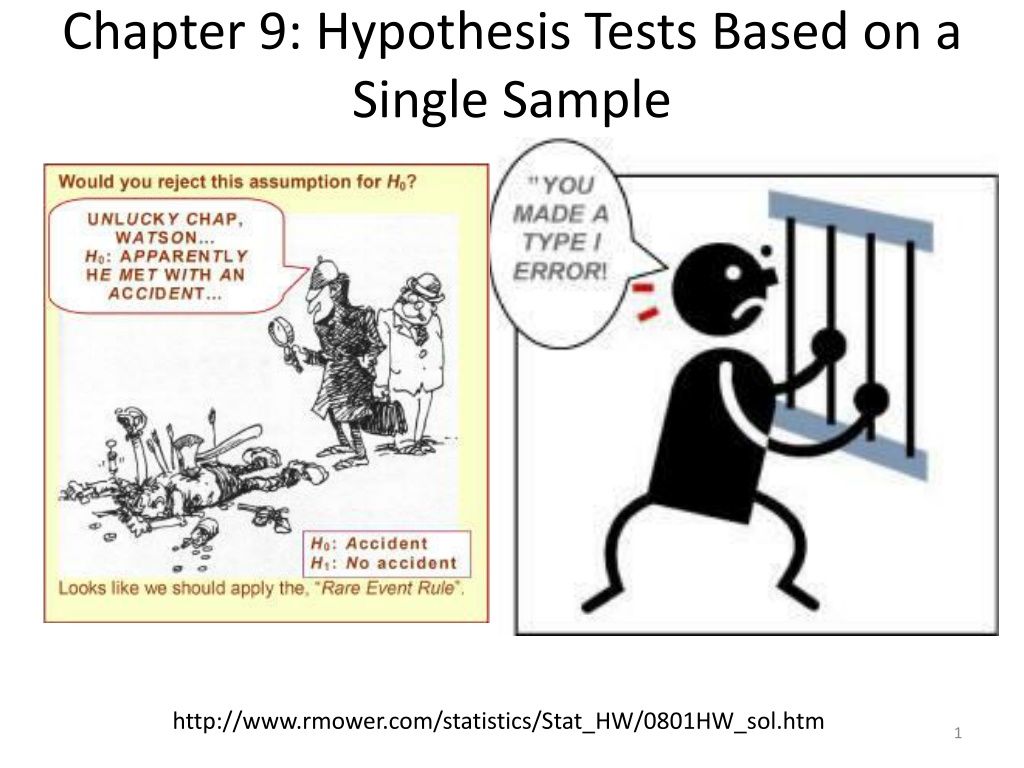
Chapter 9: Hypothesis Tests Based on a Single Sample http://www.rmower.com/statistics/Stat_HW/0801HW_sol.htm 1
Assumptions for Inference 1. We have an SRS from the population of interest. 2. The variable we measure has a Normal distribution (or approximately normal distribution) with mean and standard deviation . 3. We don t know a. but we do know (Section 9.3) b. We do not know (Section 9.5) 2
9.1: The Parts of a Hypothesis Test - Goals State the steps that are required to perform a hypothesis test. Be able to state the null and alternative hypothesis. 3
Hypothesis In statistics, a hypothesis is a declaration, or claim, in the form of a mathematical statement, about the value of a specific population parameter (or about the values of several population characteristics). A Hypothesis Test is a formal procedure for comparing observed data with a claim (also called a hypothesis) whose truth we want to assess. 4
Example: Hypothesis Test You are in charge of quality control in your food company. You sample randomly four packs of cherry tomatoes, each labeled 1/2 lb. (227 g). The average weight from your four boxes is 222 g. a) Is the somewhat smaller weight simply due to chance variation? b) Is there evidence that the calibrating machine that sorts cherry tomatoes into packs needs revision? 5
Parts of a Hypothesis Tests A. The claim assumed to be true. B. Alternative claim. C. How to test the claim. D. What to use to make the decision. 6
Statistical Hypotheses A. Null Hypothesis: H0: Initially assumed to be true. B. Alternative Hypothesis: Ha Contradictory to H0 7
Example: Significance Test You are in charge of quality control in your food company. You sample randomly four packs of cherry tomatoes, each labeled 1/2 lb. (227 g). The average weight from your four boxes is 222 g. What are some examples of hypotheses in this situation? 8
Example: Hypothesis Translate each of the following research questions into appropriate hypothesis. 1. The census bureau data show that the mean household income in the area served by a shopping mall is $62,500 per year. A market research firm questions shoppers at the mall to find out whether the mean household income of mall shoppers is higher than that of the general population. 2. Last year, your company s service technicians took an average of 2.6 hours to respond to trouble calls from business customers who had purchased service contracts. Do this year s data show a different average response time? 9
Example: Hypothesis (cont) Translate each of the following research questions into appropriate hypothesis. 3. The drying time of paint under a specified test conditions is known to be normally distributed with mean value 75 min and standard deviation 9 min. Chemists have proposed a new additive designed to decrease average drying time. It is believed that the new drying time will still be normally distributed with the same = 9 min. Should the company change to the new additive? 10
Parts of a Hypothesis Tests A. The claim assumed to be true. B. Alternative claim. C. How to test the claim. A test statistic, TS calculated from the sample data measures how far the data diverge from what we would expect if the null hypothesis H0 were true. D. What to use to make the decision. 11
Parts of a Hypothesis Tests A. The claim assumed to be true. B. Alternative claim. C. How to test the claim. D. What to use to make the decision. The p-value for a hypothesis test is the smallest significance level for which the null hypothesis, H0, can be rejected. 12
9.2: Hypothesis Test Errors and Power - Goals Describe the two types of possible errors and the relationship between them. Define the power of a test and what affects it. 13
Error Probabilities Decision Fail to reject H0 Reject H0 H0 is true H0 is false (Ha is true) Truth If we reject H0when H0is true, we have committed a Type I error. P(Type I error) = If we fail to reject H0when H0is false, we have committed a Type II error. P(Type II error) = , Power = 1 - 14
Types of Error http://www.rmower.com/statistics/Stat_HW/0801HW_sol.htm 15
Errors measures the strength of the sample evidence against H0. The power measures the sensitivity (true negative) of the test. 21
Increase the power a n 22
9.3/9.4 Hypothesis tests concerning a population mean when is known- Goals Be able to state the test statistic. Be able to define, interpret and calculate the P value. Determine the conclusion of the significance test from the P value and state it in English. Be able to calculate the power by hand. Describe the relationships between confidence intervals and hypothesis tests. 24
Assumptions for Inference 1. We have an SRS from the population of interest. 2. The variable we measure has a Normal distribution (or approximately normal distribution) with mean and standard deviation . 3. We don t know a. but we do know (Section 9.3) b. We do not know (Section 9.5) 25
Test Statistic A test statistic, TS, calculated from the sample data measures how far the data diverge from what we would expect if the null hypothesis H0 were true. 26
Hypotheses H0: = 0 Ha: 0 > 0 < 0 27
Test Statistic ???????? ???? ?????? ????? ???????? ????????? ?? ? ? ???????? ? ?0 ? ? Large values of the statistic show that the data are not consistent with H0. ???= = 28
Example: Significance Test (con) You are in charge of quality control in your food company. You sample randomly four packs of cherry tomatoes, each labeled 1/2 lb. (227 g). The average weight from your four boxes is 222 g. The packaging process has a known standard deviation of 5 g. c) What is the test statistic? d) What is the probability that 222 is consistent with the null hypothesis? 29
Example: Significance Test (con) You are in charge of quality control in your food company. You sample randomly four packs of cherry tomatoes, each labeled 1/2 lb. (227 g). The average weight from your four boxes is 222 g. The packaging process has a known standard deviation of 5 g. c) What is the test statistic? d) What is the probability that 222 is consistent with the null hypothesis? 30
P-value Right Tailed Left Tailed Two Tailed zts < 0 zts > 0 31
P-value (cont) Thep-value for a hypothesis test is the smallest significance level for which the null hypothesis, H0, can be rejected. The probability, computed assuming H0is true, that the statistic would take a value as or more extreme than the one actually observed is called the p-value of the test. The smaller the P-value, the stronger the evidence against H0. 32
P-value (cont.) Small P-values are evidence against H0because they say that the observed result is unlikely to occur when H0is true. Large P-values fail to give convincing evidence against H0because they say that the observed result is likely to occur by chance when H0is true. 33
P-value Right Tailed Left Tailed Two Tailed zts < 0 zts > 0 34
Decision Reject H0 or Fail to Reject H0 Note: A fail-to-reject H0 decision in a significance test does not mean that H0 is true. For that reason, you should never accept H0 or use language implying that you believe H0 is true. In a nutshell, our conclusion in a significance test comes down to: P-value small --> reject H0--> conclude Ha(in context) P-value large --> fail to reject H0--> cannot conclude Ha(in context) 35
Significance measures the strength of the sample evidence against H0. The power measures the sensitivity (true negative) of the test. 36
Statistically Significant measures the strength of the sample evidence against H0 If the P-value is smaller than , we say that the data are statistically significant at level . The quantity is called the significance level or the level of significance. When we use a fixed level of significance to draw a conclusion in a significance test, P-value --> reject H0--> conclude Ha(in context) P-value > --> fail to reject H0--> cannot conclude Ha(in context) 37
P-value Reject H0 Fail to reject H0 38
P-value decisions 0.1 0.001 0.02 Any value Any value 0.05 P-Value 0.02 0.02 0.02 0.9 0.00001 0.0456 Reject? 39
Statistically Significant - Comments Significance is a technical term Determine what significance level ( ) you want BEFORE the data is analyzed. Conclusion P-value --> reject H0 P-value > --> fail to reject H0 40
P-value interpretation The probability, computed assuming H0is true, that the statistic would take a value as or more extreme than the one actually observed is called the P-value of the test. The P-value (or observed significance level) is the smallest level of significance at which H0 would be rejected when a specified test procedure is used on a given data set. The P-value is NOT the probability that H0 is true. 42
Procedure for Hypothesis Testing 1. Identify the parameter(s) of interest and describe it (them) in the context of the problem. 2. State the Hypotheses. 3. Calculate the appropriate test statistic and find the P-value. 4. Make the decision (with reason) and state the conclusion in the problem context. Reject H0 or fail to reject H0 and why. The data [does or might] [not] give [strong] support (P-value = [value]) to the claim that the [statement of Ha in words]. 44
Example: Significance Test (cont) You are in charge of quality control in your food company. You sample randomly four packs of cherry tomatoes, each labeled 1/2 lb. (227 g). The average weight from your four boxes is 222 g. The packaging process has a known standard deviation of 5 g. d) Perform the appropriate significance test at a 0.05 significance level to determine if the calibrating machine that sorts cherry tomatoes needs to be recalibrated. 45
Single mean test: Summary Null hypothesis: H0: = 0 x = = 0 Test statistic: z / n Alternative Hypothesis Ha: > 0 Ha: < 0 Ha: 0 P-Value One-sided: upper-tailed One-sided: lower-tailed two-sided P(Z z) P(Z z) 2P(Z |z|) 46
Calculation of and Power A SRS of 300 Indiana high school students SAT scores are taken. A teacher believes that the mean will be no more than 1497 because that was the national average in 2013. Assume that the population standard deviation is 200. a) Assuming that the test is at a 1% significance level, determine whether this test is sufficiently sensitive (has enough power) to be able to detect an increase of 20 points in this population. 47
CI and HT 48
Example: HT vs. CI You are in charge of quality control in your food company. You sample randomly four packs of cherry tomatoes, each labeled 1/2 lb. (227 g). The average weight from your four boxes is 222 g. The packaging process has a known standard deviation of 5 g. e) Determine the 95% CI. f) How do the results of part d) and e) compare? 49
Example: HT vs. CI (2) Suppose we are interested in how many credit cards that people own. Let s obtain a SRS of 100 people who own credit cards. In this sample, the sample mean is 4 and the sample standard deviation is 2. If someone claims that he thinks that > 2, is that person correct? a) Construct a 99% lower bound for . b) Perform an appropriate hypothesis test with significance level of 0.01. c) How would the conclusion have changed if Ha: < 2? 50
Example: HT vs. CI (2) b) The data does give strong support (P = 0) to the claim that the population average number of credit cards is greater than 2. 51


")


")
")
")
")
")


")


")
")

")
")


")


")
")