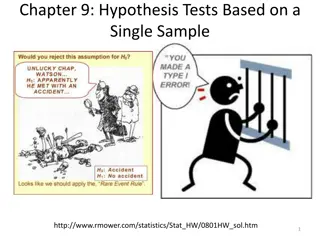
Interactive Hypothesis Testing Activity Using Beach Ball Toss
Engage students in a fun and educational activity called "Around the World in 80 Tosses" where they test hypotheses by tossing a beach ball globe to determine the percentage of Earth's surface covered by water. Through data collection, hypothesis testing, and discussions, students learn statistical concepts in a hands-on way. The activity includes steps for data collection, linking to hypothesis tests, and important notes for effective implementation.

Download Presentation

Please find below an Image/Link to download the presentation.
The content on the website is provided AS IS for your information and personal use only. It may not be sold, licensed, or shared on other websites without obtaining consent from the author. Download presentation by click this link. If you encounter any issues during the download, it is possible that the publisher has removed the file from their server.
E N D
Presentation Transcript
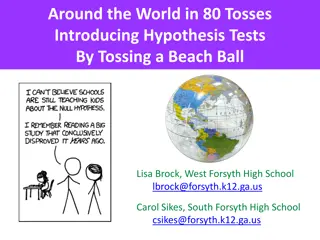
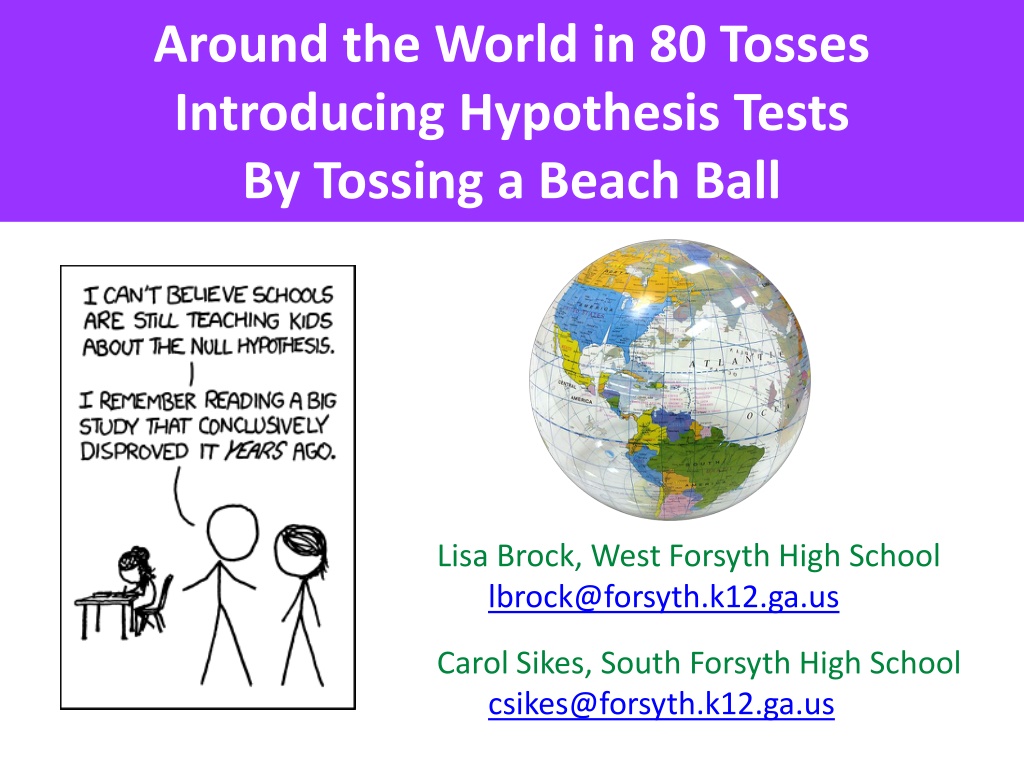
Around the World in 80 Tosses Introducing Hypothesis Tests By Tossing a Beach Ball Lisa Brock, West Forsyth High School lbrock@forsyth.k12.ga.us Carol Sikes, South Forsyth High School csikes@forsyth.k12.ga.us
Credit We first learned of this activity at a workshop facilitated by Paul Meyers. He isn t sure where it originated. Materials & Time Materials: Inflatable Globe Available from many sources, here s one with a variety of options: http://www.beachballs.com/globe-beach- balls.asp?gclid=CP66jcDz4cUCFQcyaQodBEUAHQ Marker Time: 10 minutes to collect data 30 40 minutes to walk through steps of the hypothesis test
Before Tossing the Globe Ask the class the question: How much of the Earth s surface is covered with water? Use the first student s response as the claim. (Later the null hypothesis.) Once a student s claim has been established, ask the rest of the class if they agree. If not, do you think the claim is too low, too high, or just wrong? (This will establish the alternate hypothesis.)
Data Collection Each student should put a dot in pen on the center of the thumb of their dominant hand. Toss the globe to a random student and ask them to report whether or not their thumb dot is touching land or water. Have the students continue tossing the globe around the room to each other, indicating where the dot landed. Record a frequency table on the board for water versus land as the students randomly toss the globe to each other throughout the room. Collect at least 80 observations. (should result in np and n(1-p) both being > 10).
Linking to a Hypothesis Test Use the activity data to walk students through a hypothesis test: Translate original claim and class response into appropriate hypotheses Link probability calculation to sampling distribution of p-hat with n = # of tosses Check the conditions related to the shape, center, and spread of the sampling distribution Perform the probability calculation Discuss what the probability means Is this likely to have happened if the claim was correct? Link to the decision
Some Things to Note We teach hypothesis tests before intervals immediately following sampling distributions this makes the calculation of the p-value in this way very natural to the students. If your original claim is fairly reasonable, it is likely you will fail to reject the null. Data collection can vary greatly in this activity, so encourage students to toss the globe far enough to randomize the outcome and to look carefully at where the dot actually landed. HAVE FUN!! (The kids usually do )