Understanding Different Methods for Calculating Averages
Exploring two distinct ways of organizing data for calculating averages using household income as an example. Learn how to compute the mean in both scenarios and dive into the mathematical formulas involved.

Download Presentation

Please find below an Image/Link to download the presentation.
The content on the website is provided AS IS for your information and personal use only. It may not be sold, licensed, or shared on other websites without obtaining consent from the author. Download presentation by click this link. If you encounter any issues during the download, it is possible that the publisher has removed the file from their server.
E N D
Presentation Transcript
Workshop: Introduction to Sampling Weights, Summer 2022 Presenter: James W. Hardin
Yikes! Youre going to talk about math, aren t you? I am going to keep my presentations and explanations to a mathematical minimum. All that we will really discuss is that an average is the total sum divided by the number of observations.
DATA I want you to imagine two different ways in which data could be stored. There are 102 values for household income (Hhinc). Look at the following two approaches to organizing data Organization 1 Organization 2 Row Hhinc 1 31000 2 31000 100 31000 101 200000 102 200000 Row Hhinc 1 31000 2 200000 NumHousesWithHHinc 100 2 How do you calculate the mean for each of these organizations?
For the first organization, we could just add up all 102 values of the hhinc variable and then divide by 102. Organization 1 Row Hhinc 1 31000 2 31000 100 31000 101 200000 102 200000 Total = 31,000+31,000+31,000+ + 31,000 + 200,000 + 200,000 = 3,500,000 Average = 3,500,000 / 102 = 34,313.725
For the second organization, we could just add up all 2 values of the hhinc variable and then divide by 2. Organization 2 Row Hhinc 1 31000 2 200000 NumHousesWithHHinc 100 2 Total = 31,000 + 200,000 = 231,000 Average = 231,000 / 2 = 115,500.00
Lets calculate the average a bit more carefully using that second organization. Organization 2 Row Hhinc 1 31000 2 200000 NumHousesWithHHinc 100 2 Total = (31,000*100) + (200,000*2) = 3,100,000 + 400,000 = 3,500,000 Number of observations = 100 + 2 = 102 Average = 3,500,000 / 102 = 34,313.725
So, lets notice that the usual mathematical formula for the average ? ?=1 ?? ? can be written ? ?=1 ?=1 ???? ?? ?
? ?=1 ?=1 ???? ?? ? Organization 1 Organization 2 Row Hhinc 1 31000 2 31000 100 31000 101 200000 102 200000 Row Hhinc 1 31000 2 200000 NumHousesWithHHinc 100 2 ??= 1 ??= ???????????? ? ???? ? = 1, ,2 ? = 1, ,102
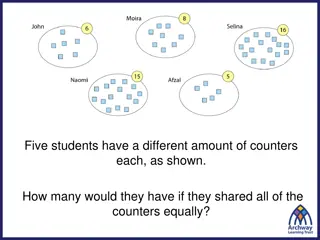
What we have learned is that when we want to estimate an average, we can think of that as a value along with how many such values there are in the sample. Just as we saw in the initial few slides, if you don t properly incorporate survey weights into calculations, your estimates will not represent what you intend. This is directly comparable to the function of survey weights. Survey weights play this exact role except that they are related to the number of similar households in the entire population Let s go over one more generalization that is the idea of a subpopulation mean.
Lets imagine that there are 4 different subpopulations. These 4 subpopulations are mutually exclusive. That is, there is no single household that is in more than one of our subpopulations, and every single household is in one of these 4 subpopulations. Imagine that subpopulation 1 has mean equal to ?1 and has ?1 observations Imagine that subpopulation 2 has mean equal to ?2 and has ?2 observations Imagine that subpopulation 3 has mean equal to ?3 and has ?3 observations Imagine that subpopulation 4 has mean equal to ?4 and has ?4 observations
Lets imagine that there are 4 different subpopulations. These 4 subpopulations are mutually exclusive. That is, there is no single household that is in more than one of our subpopulations, and every single household is in one of these 4 subpopulations. Imagine that subpopulation 1 has mean equal to ?1 and has ?1 observations Imagine that subpopulation 2 has mean equal to ?2 and has ?2 observations Imagine that subpopulation 3 has mean equal to ?3 and has ?3 observations Imagine that subpopulation 4 has mean equal to ?4 and has ?4 observations
It should be clear that the total of the observations in subpopulation 1 is ?1?1 the total of the observations in subpopulation 2 is ?2?2 the total of the observations in subpopulation 3 is ?3?3 the total of the observations in subpopulation 4 is ?4?4 Thus, the total for the entire population is ?1?1+ ?2?2+ ?3?3+ ?4?4 The total number of households for the entire population is ?1+ ?2+ ?3+ ?4 The average for the entire population is ?1?1+?2?2+?3?3+?4?4 ?1+?2+?3+?4
Now, imagine that we have a sample from this population. If the sample were a simple random sample, we would have a bunch of households that were chosen across the entire population. Each observation has a chance of ? Every single household has the same chance of being selected. ?of being selected into the sample. Likewise, we could conclude that each observation represents ? households. ? similar We might be able to estimate the subpopulation means, but we might not have any observations from those subpopulations in our simple random sample.
The strength of the simple random sample is that the estimation of the population mean is always possible and is straightforward. One could even use the sample mean as an estimator. The weakness is that we may or may not be able to estimate subpopulation means. If we have specific hypotheses that compare subpopulation means, our entire study is at risk if our simple random sample does not include representatives of all relevant subpopulations. To overcome this weakness, we can draw different kind of random sample. That is, instead of just randomly sampling some households, we can purposely choose to sample a specific number of households from each subpopulation.
Imagine that we purposely sample ?1 of the ?1 observations, ?2 of the ?2 observations, ?3 of the ?3 observations, and ?4 of the ?4 observations. In a sense, we stratify the population into the 4 strata of interest and then draw separate random samples from each of them. In this way, we ensure that we collect data from all of the subpopulations. We are then able to entertain hypotheses comparing means of these subpopulations. At the same time, we can also estimate the population mean, but we have to ensure that we keep in mind how many households each sampled household represents. This will be a slightly different calculation for each subpopulation.
clear /* We use data from the Second National Health and Nutrition Examination Survey (NHANES II) (McDowell et al. 1981) as our example. This is a national survey, and the dataset has sampling weights, strata, and clustering. In this example, we will consider the estimation of the mean serum zinc level of all adults in the United States. */ use https://www.stata-press.com/data/r17/nhanes2f /* First, consider a proper design-based analysis, which accounts for weighting, clustering, and stratification. Before we issue our svy estimation command, we set the weight, strata, and PSU identifier variables: */ svyset psuid [pweight=finalwgt], strata(stratid) svy: mean zinc
// What happens if we ignore the complex survey information // Do we get the correct estimate? // Do we get the correct standard error of the estimate so that our hypothesis tests are correct? summ zinc mean zinc // What happens if we specify the weights, but fail to specify the strata // Do we get the correct estimate? // Do we get the correct standard error of the estimate so that our hypothesis tests are correct? svyset psuid [pweight=finalwgt] svy: mean zinc // What about when we want to estimate a regression model // First, we correctly specify the weights and strata // Second, we specify a regression model using that information svyset psuid [pweight=finalwgt], strata(stratid) svy: regress zinc age c.age#c.age weight female black orace rural // What would have happened if we ignored our complex survey information? // Point estimates are 3% to 100% different // Std errors are 30% to 110% larger for the correct model regress zinc age c.age#c.age weight female black orace rural