Overview of Food Price Trends and Consumer Expenditures in the US

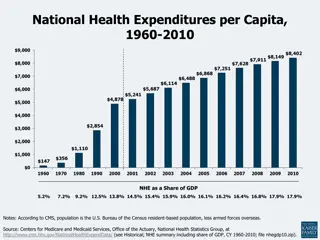
The presentation highlights the consumer spending on food, food price trends over time, 2021 food prices, and forecasts for 2022 in a historical context. It emphasizes that U.S. consumers spent 12% of their expenditures on food in 2020, aligning with historical averages. Food price inflation remained below housing and transportation costs over the past five years. The data also shows that consumers spent varying amounts on different food categories, with price growth differing between food consumed at home and away from home.

Download Presentation

Please find below an Image/Link to download the presentation.
The content on the website is provided AS IS for your information and personal use only. It may not be sold, licensed, or shared on other websites without obtaining consent from the author. Download presentation by click this link. If you encounter any issues during the download, it is possible that the publisher has removed the file from their server.
E N D
Presentation Transcript
Food Price Outlook Matthew MacLachlan USDA - Economic Research Service 2022 USDA Agricultural Outlook Forum February 24th 25th, 2022
Outline 1. Overview of consumer spending on food 2. Food price trends over time 3. Food prices in 2021 4. 2022 food price forecasts in (recent) historical context 5. Next Food Price Outlook release: Friday, Feb. 25th 6. Additional ERS Publications 2
Most of the information in this presentation can be found on ERS s website Food Price Outlook Monthly Report ERS Food Price Environment: Interactive Visualizations Charting the Essentials Charts of Note 3
On average, U.S. consumers spent 12 percent of expenditures on food in 2020 Share of U.S. household consumer expenditures by major categories Source: USDA - ERS using BLS Consumer Expenditure Survey Data 4
On average, U.S. consumers spent 12 percent of expenditures on food in 2020 Share of U.S. household consumer expenditures by major categories Fraction of expenditures spent on food in 2020 similar to historical average Source: USDA - ERS using BLS Consumer Expenditure Survey Data 5
Food price inflation was below housing and transportation over the past 5 years and slightly above the 5-year inflation rate of all items Source: USDA - ERS using BLS Consumer Expenditure Survey Data 6
Consumers spent different amounts on food categories weighting within CPIs accounts for these differences Source: USDA - ERS using BLS Consumer Expenditure Survey Data 7
ERS also reports subcategories of food Source: USDA - ERS using BLS Consumer Expenditure Survey Data 8
Price growth differs for food consumed at home versus away from home; more similar during the pandemic Source: USDA - ERS using BLS Consumer Expenditure Survey Data 9
Annual percent changes in retail prices, 2021 Source: USDA - ERS using BLS Consumer Expenditure Survey Data 10
Annual percent changes in retail prices, 2021 9.3% 8.6% Source: USDA - ERS using BLS Consumer Expenditure Survey Data 11
Annual percent changes in retail prices, 2021 1.1% Source: USDA - ERS using BLS Consumer Expenditure Survey Data 12
What to watch for in 2022? Pandemic-related changes Variants Vaccination Disease mitigation Additional factors International trade Supply chains U.S. economy 13
2022 food price inflation forecasted between 2 and 3% Source: USDA - ERS using BLS Consumer Expenditure Survey Data 14
Meat prices increased near the onset of the pandemic and again in late 2021 Source: USDA - ERS using BLS Consumer Expenditure Survey Data 15
Food away from home prices increased more rapidly than in recent history; expected price inflation between 3.5 and 4.5% in 2022 Source: USDA - ERS using BLS Consumer Expenditure Survey Data 16
Takeaways Last year (2021) High food price inflation Meat prices increased more than other categories Prices did not decrease for any category; vegetables had the smallest price increase Next year (2022) Pandemic-related factors will continue to present uncertainty Food prices predicted to increase 2-3%; food-away-from-home prices predicted to increase 3.5-4.5% 17
Whats next? Food Price Outlook updated: Friday, Feb. 25th Forecasts cover the current calendar year, and the succeeding calendar year, starting in July Forecast 7 farm, 6 wholesale, and 22 retail food categories Available at www.ers.usda.gov/data-products/food-price-outlook Additional research addressing forecasting methods used in the Food Price Outlook 18
Other work from ERS Food Markets Branch USDA Food Dollar Series: Measures annual expenditures on food. www.ers.usda.gov/data-products/food-dollar- series Food Expenditure Series: Comprehensive data on the U.S. food systems, quantifying the value of food acquired in the United States by type of product, outlet, and purchaser. www.ers.usda.gov/data-products/food- expenditure-series Price Spreads from Farm to Consumer: Comparisons or prices paid by consumers with prices received by farmers for corresponding commodities. www.ers.usda.gov/data- products/price-spreads-from-farm-to-consumer 19
Additional ERS resources Amber Waves: Current ERS economic and policy research on agriculture, food, rural America, and the environment for policymakers, academics, and the public. Charts of Note: Highlights from ERS current and past research. A version of the 2022 food-at-home forecast slide is a Chart of Note. Charting the Essentials: 70 charts and maps covering key information about agricultural markets and trade, farm income, food prices and consumption, food security, rural economies, and the interaction of agriculture and natural resources. Subscribe online for email notifications on updates to these and more. 20
Thank you! Matthew MacLachlan Food Markets Branch, Food Economics Division USDA - Economic Research Service Matthew.MacLachlan@usda.gov 21