Understanding CBA Results Files and Modelling Outputs

The content provides a detailed guide on accessing and utilizing CBA Results Files, including tips on reading the CBA Methodology and understanding various indicators and economic templates. It also highlights the importance of analyzing disrupted rates, quantities, flexibility, and other key components involved in the modelling process.

Download Presentation

Please find below an Image/Link to download the presentation.
The content on the website is provided AS IS for your information and personal use only. It may not be sold, licensed, or shared on other websites without obtaining consent from the author. Download presentation by click this link. If you encounter any issues during the download, it is possible that the publisher has removed the file from their server.
E N D
Presentation Transcript
CBA Results Files Getting started
Getting started We highly encourage you to > Read the CBA Methodology: Annex F on Methodology of TYNDP 2015 http://www.entsog.eu/public/uploads/files/publications/TYNDP/2015/TYNDP022- 150316_Annex_F_lowres.pdf And ESW-CBA Methodology http://www.entsog.eu/public/uploads/files/publications/CBA/2015/INV0175- 150213_Adapted_ESW-CBA_Methodology.pdf > Read the TYNDP 2015 http://www.entsog.eu/publications/tyndp#ENTSOG-TEN-YEAR-NETWORK- DEVELOPMENT-PLAN-2015 2
Getting started 12 Result files for each Group of projects > DISRUPTED RATE > DISRUPTED QUANTITY > REMAINING FLEXIBILITY > INDICATORS Modelling results > MONETIZATION > MARGINAL PRICE > GPI > FLOWS > CO2 and demand > IMPORT ROUTE DIV Capacity-based indicators results > N-1 ESW CBA Economic Template > Economic Template 3
Getting started Units of the files Units DISRUPTED RATE % of country (or balancing zone* ) demand daily basis DISRUPTED QUANTITY GWh/d daily basis REMAINING FLEXIBILITY % of country (or balancing zone* ) demand daily basis INDICATORS SSPDi = % of supply price diversification on country Gas Bill yearly basis SSPDe= % of supply price dependence of country Gas Bill yearly basis USSD/CSSD= % of country demand on yearly basis yearly basis MONETIZATION EUR/d daily basis MARGINAL PRICE EUR/GWh GPI EUR/GWh FLOWS GWh/d daily basis CO2 and demand CO2= in tons daily basis demand= in GWh daily basis IMPORT ROUTE DIV no unit (HHI index) N-1 % of country demand daily basis Economic template Bill components= 10^6 EUR/year yearly basis *: for country having more than 1 balancing zone 4
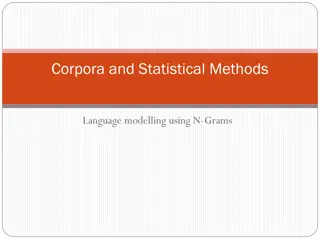
Overview of Modelling results Ref case LNG RU NO DZ LY AZ ch exp ch exp ch exp ch exp ch exp ch exp Normal situation (NONE) RU transit disruption NO transit disruption DZ transit disruption LY transit disruption AZ transit disruption Transmed Langeled Ukraine DISRUPTED RATE DISRUPTED QUANTITY REMAINING FLEXIBILITY Green Stream TANAP Franpipe Belarus MEG MONETIZATION MARGINAL PRICE GPI INDICATORS: USSD/CSSD (supply dependence) _LNG _RU _NO _DZ _LY _AZ INDICATORS: SSPDe_ (price dependence) _LNG _RU _NO _DZ _LY _AZ INDICATORS: SSPDi_ (price diversification) _LNG _RU _NO _DZ _LY _AZ 5
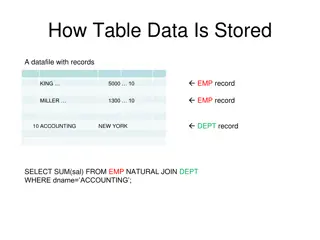
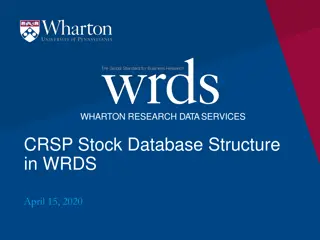
File Worksheet Files structure DISRUPTED RATE START-END Values DISRUPTED QUANTITY START-END Values Common File structure for these Files and Worksheets REMAINING FLEXIBILITY START-END Values INDICATORS START-END All Clusters MARGINAL PRICE START-END Values GPI START-END Values PROJECT IMPACT in FID 2 015 2 020 0 0 0 0 0 0 0 0 0 0 0 0 0 0 0 0 0 0 0 0 0 0 0 0 0 0 0 0 0 0 0 0 FID- 2 015 FID+ 2 015 Select country Country Code YES YES YES YES YES YES YES YES YES YES YES YES YES YES YES YES YES YES YES YES YES YES YES YES YES YES YES YES YES YES YES YES 2 025 2 030 2 035 2 020 2 025 2 030 2 035 2 020 2 025 2 030 2 035 Country 1 Country 2 Country 3 Country 4 Country 5 Country 6 Country 7 Country 8 Country 9 Country 10 Country 11 Country 12 Country 13 Country 14 Country 15 Country 16 Country 17 Country 18 Country 19 Country 20 Country 21 Country 22 Country 23 Country 24 Country 25 Country 26 Country 27 Country 28 Country 29 Country 30 Country 31 Country 32 C1 C2 C3 C4 C5 C6 C7 C8 C9 C10 C11 C12 C13 C14 C15 C16 C17 C18 C19 C20 C21 C22 C23 C24 C25 C26 C27 C28 C29 C30 C31 C32 0 0 0 0 0 0 0 0 0 0 0 0 0 0 0 0 0 0 0 0 0 0 0 0 0 0 0 0 0 0 0 0 0 0 0 0 0 0 0 0 0 0 0 0 0 0 0 0 0 0 0 0 0 0 0 0 0 0 0 0 0 0 0 0 0 0 0 0 0 0 0 0 0 0 0 0 0 0 0 0 0 0 0 0 0 0 0 0 0 0 0 0 0 0 0 0 0 0 0 0 0 0 0 0 0 0 0 0 0 0 0 0 0 0 0 0 0 0 0 0 0 0 0 0 0 0 0 0 Impact of the Group (=difference between Final and Initial Situations) along the years Results in Initial Situation (=without Group) along the years Results in Final Situation (=with Group) along the years Results along the countries 6
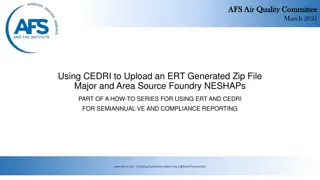
Files structure (modelling results files) Drop down list to select the results you want to look at Global context Disruption scen Infra. scen Temporal period Global Disruption Cluster Temporal Period GREEN NONE FID DC > DISRUPTED RATE > DISRUPTED QUANTITY > REMAINING FLEXIBILITY Global Cluster Indicator GREEN FID SSPDi - LNG > INDICATORS Indicators Global Disruption Gas Price Scenario GREY NONE > MONETIZATION Price Conf. RUm expensive > MARGINAL PRICE Global Temporal Period Cluster Gas Price Scenario GREY AW FID NO cheap Temporal period > GPI Price Conf. 7
Modelling results - 1 Disruption and Remaining Flexibility > No supply price configurations for these indicators > Calculated at country (or BZ) level > To be looked at under high demand situations: DC (=Design Case) and 2W (=2 weeks cold spell) > Disruption Rate: measures the share of country s demand which cannot be supplied A 0% disruption rate means the country is not facing disruption A 10% disruption on peak day means that the country s infrastructures only allow to supply 90% of its peak demand > Remaining Flexibility: measures the additional demand the country could cope with, expressed as share of the country s actual demand A 20% remaining flexibility means the country could cope with a 20% increase of its demand > Above indicators are also calculated under 8 route disruption scenarios (Ukraine, Belarus, ) 8
Modelling results - 2 Monetized results > Monetized results are calculated under the 13 price configurations > EU Bill > Marginal Price: by country (even by balancing zone) To be looked at for AW (=Average winter) and AS (=Average summer) > GPI (Gas Price Index): proxy for the country gas Bills, calculated by country To be looked at for AW (=Average winter) and AS (=Average summer) 9
Modelling results - 3 Indicators > Indicators are calculated for each of the 6 supply sources. > They are calculated at country level on a yearly basis > Supply source dependence measures the share of country s demand that cannot be supplied if EU faces a total absence of this source. It is calculated both under uncooperative (USSD) and cooperative (CSSD) behaviour between countries A country s uncooperative dependence of 40% to LNG means that this country needs at least 40% of LNG to supply its demand, if not supported by other countries > Supply price dependence (SSPDe) measures the dependence of country gas bill on that source A country s price dependence of 40% to Norwegian gas means that an increase of 10% of Norwegian price would induce a 4% increase of the country s gas bill > Supply price diversification (SSPDi) measures the ability of each country to take advantage on a cheap source in its gas bill A country s price diversification of 30% to Algerian gas means that a decrease of 10% of Algerian price would be reflected in a 3% decrease of the country s gas bill 10
Capacity-based results N-1 > N-1 for ESW-CBA: calculation based on capacities and peak demand (non modelled) 11
Capacity-based results N-1 > N-1_ESW-CBA Result file: impact of Group of projects provided By country In 2 worksheets o N-1_green for GREEN global context (using countries GREEN peak demand) o N-1_grey for GREY global context (using countries GREY peak demand) In these worksheets for the 2 Infrastructure scenarios o Low Infrastructure scenario: lines 4 to 33 o High Infrastructure scenario: lines 36 to 65 Detail by country to be found in the Countries Worksheets 12
Capacity-based results - IRD > Import Route Diversification (IRD): HHI index which measures the diversification of paths that gas can flow through to reach a zone. Together with the Supply Source Price Diversification, it provides a proxy to the assessment of counterparty diversification. 13
Capacity-based results - IRD > IMPORT ROUTE DIV Result File: impact of Group of projects provided in columns BG to BQ, under Infra Scenarios HUGH (BH to BL) and LOW (BM to BQ) by country (green lines) Interpretation of figures (50)= -50 = decrease 40 = +40 = increase - = no impact 14
Thank You for Your Attention ENTSOG -- European Network of Transmission System Operators for Gas Avenue de Cortenbergh100, B-1000 Brussels celine.heidrecheid@entsog.eu; adam.balogh@entsog.eu EML: WWW: www.entsog.eu


")