Understanding Diversity Analysis Using VCF Files

This lecture introduces the analysis of population diversity using VCF files. It covers file types, manipulation techniques, and key tools like vcftools and bcftools. Learn about the differences between vcf.gz and vcf files, how to convert between them, and open, compress, and index VCF files for analysis.

Download Presentation

Please find below an Image/Link to download the presentation.
The content on the website is provided AS IS for your information and personal use only. It may not be sold, licensed, or shared on other websites without obtaining consent from the author. Download presentation by click this link. If you encounter any issues during the download, it is possible that the publisher has removed the file from their server.
E N D
Presentation Transcript
Lecture 6 Introduction to diversity analysis
Overview We will be covering the following within this lecture and following workshop: What file types will be looking at Summary statistics can we use to analysis population diversity Tajima s D What is What is FST How can we use these to understand populations
File types We will be using VCF files primarily which you should already be familiar with Do you know what the differences between these key file types are we can use with VCF tools? vcf.gz files vs vcf files How can we convert a vcf.gz from a vcf file? How can we convert a vcf.gz into a vcf file? VCFtools which we will be using generates log files and tab seperated text files when you perform various analyses, you will need to become familiar with opening/closing/editing these file types
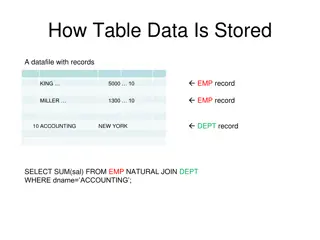
VCF files These have a .vcf extension and are human readable. The format of this file type can be found here http://www.internationalgenome.org/wiki/Analysis/Variant%20Call%20Format/vcf-variant-call-format- version-40/ VCF files are human readable, compressed VCF files (gz) are not, and can be open using zless Some programmes require your VCF files to be compressed and indexed This file is comprised of two key parts, a header and the main body of the file. Header lines are started with # We can use the header to tell us information about the sample The body of the file is kept in the same format, with CHROM, the position the variant is in, and the REFerence and ALTernate allele as the first columns as shown below
Manipulating VCF files There are two key packages we will be using, that use VCF files. These are vcftools and bcftools. Bcftools is newer and has the ability to convert VCF files into BCF files. Two other packages that are used to compress and index vcftools (bgzip and tabix) we will also use First we should familiarize ourselves with the format of the VCF files we can do this is Sample1.vcf that we made earlier. To open the vcf file we can do the following: less Sample1.vcf We can see various information about this single sample. Can you tell what the original sample name was? They began with ERR and you should be able to see them in the header lines
Manipulating VCF files Some tools will need you to feed in a vcf.gz file. We can convert our vcf to a vcf.gz using bgzip and tabix from the htslib package First we should load this module module load htslib We should also make sure that vcftools and bcftools are loaded module list (will show us what is loaded) if vcftools and bcftools are not here, we can load them as above In order to compress and index the vcf file we first need to use bgzip to compress the vcf file as follows: bgzip Sample1.vcf This will generate a Sample1.vcf.gz file. In order to now generate a vcf index we need to now use tabix: tabix p vcf Sample1.vcf.gz We can then uncompress this if needed using gzip gzip Sample1.vcf.gz
Manipulating VCF files You can specify whether you re inputting a vcf or .vcf in vcftools using the --gzvcf Sample1.vcf.gz or --vcf Sample1.vcf We can either pipe output to a file using > or you can specify out which will give the prefix for the file using --out For example: We can calculate the allele frequency in a vcf file using --freq flag vcftools --gzvcf Sample1.vcf.gz --freq --out Sample1 This says use a gzipped vcf, output a file with allele frequency (will end .freq in output) and output a file prefixed with Sample1 Our vcf file contains SNPs and INDELs. We can remove indels using --remove-indels flag. In this case we want to make a new vcf file, we can do this using the flag --recode vcftools --vcf Sample1.vcf --remove-indels --recode --out Sample1_SNPs_only This uses a vcf file instead, removes indels, and makes a new vcf file called Sample1_SNPs_only_recode.vcf We can also filter using identifies in the reference, for example if we look at the reference fasta you will see each chromosome header has >chr1. We can filter for sites only on chromosome 1 using the following vcftools --vcf Sample1.vcf --chr chr1 --out Chr1_only
Manipulating VCF files There are lots of other utilities in vcftool and bcftools which we will show you later but you can find from the manual Several of the most common uses/features you might want to try are the following? Can filter by a list of positions, which may represent genes you want to look at using --positions file.list where file.list is a tab seperated file with the chr and position Can also look at only indels with --keep-only-indels You can also filter sites by their minor allele frequency using --maf You can also filter for sites that only have a minimum level of coverage using --min-meanDP Can specify individuals to keep/filter your vcf for --indv VCFtools can also be used to perform some statistical analyses We will use some of the following: --window-pi --weir-fst-pop --TajimaD
Manipulating VCF files In the next workshop you will learn about population structure and how to identify and classify samples based on. For now we are going to give you a file containing multiple individuals, and two lists forming two populations so that we can perform some statistics on these. This multisample vcf is called all_samples.vcf The two sample lists are within the course material folder, population_list1 and population_list2 If you open these files you will see that they contain just a list of the sample names for each population You will be using bcftools to filter using these samples list as follows because it has additional functions: bcftools view -Ov -S population_list1 all_samples.vcf -o population_list1.vcf This means open the multisample vcf, -Ov is the output type, v means output as uncompressed vcf, -S is the name of a file with a list of samples, -o means what is the output name. bcftools view -Ov -S population_list1 all_samples.vcf > population_list1.vcf The above command does the same, -o and > can be used interchangeably Repeat this for both populations so that you have a vcf for each population
Nucleotide diversity () Nucleotide diversity ( ) Nucleotide diversity is used to measure the degree of polymorphism within a population. A common measure of nucleotide diversity was first introduced by Nei and Li in 1979. This measure is defined as the average number of nucleotide differences per site between two DNA sequences in all possible pairs in the sample population. We can calculate using vcftools. We can do this per SNP, however if we take a window covering at least ten SNPs, this is often a far more accurate way to calculate, and can reduce the power of spurious mutations. We can calculate this in vcftools using the following command vcftools --vcf population_list1.vcf --window-pi 10000 --out population_list1_pi This will generate a tab seperated file prefixed population_list1_pi with a value for every 10,000 bases across the genome We can use these values to plot a graph of the distribution of across the genome for each population
Can we test for selection We can also perform statistics which allow us to see whether a population is neutrally evolving or whether it is under selective pressures. One of the measures we can use to test for this is Tajima s D This is a test for balancing selection and is calculated using the ratio of segregating to non segregating variants in a population (INSERT DERIVATION AND PLOT WITH TAJIMAD -1, 1 normal distribution Similarly we can use vcftools to perform this test vcftools --vcf population_list1.vcf --TajimaD 10000 --out population_list1_tajD As before we can test over a window, this is usually robust if the window covers at least 10 variants within the window. You can now perform this on both populations and the unseperated file of populations
Calculating FST Another important method used in population genetics fixation index (FST). FST ranges from 0 to 1. FST is a measure of population differentiation due to genetic structure. FSTcan be interpreted as measuring how much closer two individuals from the same subpopulation are, compared to the total population If two populations are less related and share few SNPs, FST will be low: eg 0.9 If two populations are closely related and share many SNPs: FST will be low: eg 0.1 We can use this measure in order to identify the relationship between individuals and can be used to identify populations that are more, or less separated. We compare pairwise between a set of populations or between individuals in vcftools: vcftools --vcf all_samples.vcf --weir-fst-pop population_list1 --weir-fst-pop population_list2 --out pop1_vs_2_FST In the above command, --weir-fst is specified twice to give the lists of individuals from the two population file, that form each population. The population lists we had previously, have been used here to specify each population. See: https://en.wikipedia.org/wiki/Fixation_index


")