Teaching Statistics with Minimal Mathematics: A Practical Approach by Alan S. Chesen
Alan S. Chesen, a faculty member at Wright State University, provides insights on teaching statistics with minimal mathematics. He emphasizes the use of statistical software over complex math techniques, preparing students to interpret and apply statistical studies in real-world scenarios. By utilizing PHStat and focusing on concepts like confidence intervals and hypothesis testing, Chesen aims to equip students with practical skills for their future endeavors.

Download Presentation

Please find below an Image/Link to download the presentation.
The content on the website is provided AS IS for your information and personal use only. It may not be sold, licensed, or shared on other websites without obtaining consent from the author. Download presentation by click this link. If you encounter any issues during the download, it is possible that the publisher has removed the file from their server.
E N D
Presentation Transcript
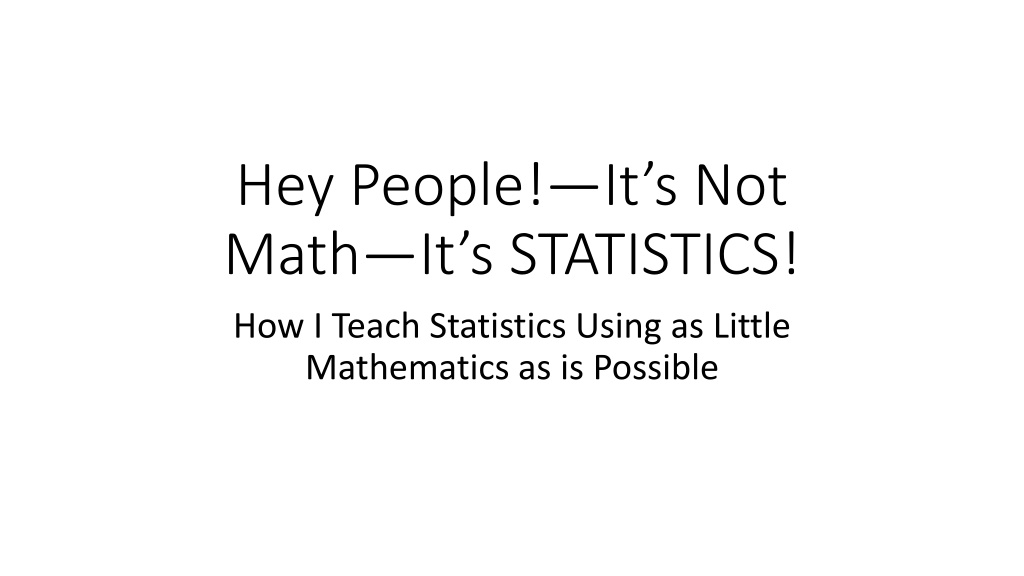
Hey People!Its Not Math It s STATISTICS! How I Teach Statistics Using as Little Mathematics as is Possible
Who Am I?I Am Alan S. Chesen, Faculty Member Department of Information Systems and Supply Chain Management Raj Soin College of Business Wright State University Dayton, Ohio 45435 alan.chesen@wright.edu
Before I StartA Question for my Audience The question is--Why is Wright State University in the national news/going to be in the national news in 2016? Hint: September 26, 2016 The answer is
Why Do I Choose to Do What I Do in the Way I Do It? In the workplace, my students will not do (will perform very few) statistical techniques. Students will, in their employment environments, utilize in some way, shape or form some sort of statistical software. More than likely, what they will do most often is to utilize the results of statistical studies that have been accomplished by others. To do this they will obviously need to know how to understand and interpret these types of studies in order to apply the stated results for the benefit of their specific organizations. In my classes, students must interpret statistical software outputs on the in-class tests they complete as a part of the evaluation process. Also, students have to utilize the statistical software correctly as a part of the out-of-class projects that are an additional part of the evaluation process. I can cover more material this way. I have time to utilize techniques other than traditional lectures in my courses. I am cognizant that I must not sacrifice understanding of the material and of the underlying statistical concepts because I have the ability to utilize the technology and non-mathematical instructional techniques as a substitute for traditional lecture methods.
Software I choose to use PHStat, an enhancement to Microsoft Excel as my software of choice. It is believed by many faculty in my department and college that constant and repeated exposure to Microsoft Excel in a variety of ways is paramount in colleges and schools of business. While I admit that PHStat may not be the best package one can use, it serves my purposes. My goal is not to make my students software experts; rather it is to use a relatively powerful yet easy to use mechanism designed to effectively teach the discipline of statistics to them. I would not be averse to utilizing a more sophisticated statistical package such as Minitab or SAS to do what I do.
Specific Examples of How I Test Students Using Statistical Software Printouts Topics Statistical estimation (interval estimation) using confidence intervals Statistical decision making using hypothesis testing
Confidence Intervals An example problem: The mean time it takes for a population of office workers to complete a certain task is to be estimated with 95% confidence. A random sample of 21 workers is selected. Their mean time is found to equal 26.7 minutes with a standard deviation of 3.4 minutes. Find the required 95% confidence interval. Explain its meaning in the context of the problem. Assume that the times it takes to complete the task on the part of this population are normally distributed.
Full Solution Using PHStat Confidence Interval (t interval) Data Sample Standard Deviation Sample Mean Sample Size Confidence Level 3.4 26.7 21 95% Intermediate Calculations Standard Error of the Mean Degrees of Freedom t Value Interval Half Width 0.741940827 20 2.0860 1.5477 Confidence Interval Interval Lower Limit Interval Upper Limit 25.15 28.25
Solution as it is Presented to Students on a Test Confidence Interval (t interval) Data Sample Standard Deviation Sample Mean Sample Size Confidence Level 3.4 26.7 21 95% Intermediate Calculations Standard Error of the Mean Degrees of Freedom t Value Interval Half Width 0.741940827 20 2.0860 1.5477 Confidence Interval
One Sample Hypothesis Testing An example problem: A compensation analyst wishes to decide if the mean salary in a certain profession for persons with at least 10 years of experience working in a certain market is greater than $100,000. She selects a random sample of 17 employees. It is found that their mean salary is $107,255 with a standard deviation of $13,415. At the 10% level of significance, is the mean salary for this population of employees greater than $100,000? Assume that the salaries for this population of employees are normally distributed. As a part of your work, you must state both the null and alternative hypotheses for this situation, state the calculated value of the test statistic for the problem, make the proper statistical decision based upon the use of an appropriate criterion, state that criterion, and provide an explanation of the meaning of your decision in the context of the problem.
Full Solution Using PHStat One Sample Hypothesis Test (t-test) Data Null Hypothesis = Level of Significance Sample Size Sample Mean Sample Standard Deviation 100000 0.1 17 107255 13415 Intermediate Calculations Standard Error of the Mean Degrees of Freedom t Test Statistic 3253.6154 16 2.2298 Upper-Tail Test Upper Critical Value p-Value Reject the null hypothesis 1.3368 0.0202
Solution as it Might be Presented to Students on a Test One Sample Hypothesis Test (t-test) Data Null Hypothesis = Level of Significance Sample Size Sample Mean Sample Standard Deviation 100000 0.1 17 107255 13415 Intermediate Calculations Standard Error of the Mean Degrees of Freedom t Test Statistic 3253.6154 16 2.2298 Upper-Tail Test Upper Critical Value p-Value 0.0202
Another Possible Solution that Might be Presented to Students on a Test One Sample Hypothesis Test (t-test) Data Null Hypothesis = Level of Significance Sample Size Sample Mean Sample Standard Deviation 100000 0.1 17 107255 13415 Intermediate Calculations Standard Error of the Mean Degrees of Freedom t Test Statistic 3253.6154 16 2.2298 Upper-Tail Test Upper Critical Value p-Value 1.3368
Two Sample Hypothesis Testing A political analyst is interested in comparing the proportions of Republicans and Democrats concerning their feeling about whether their party s candidate won a particular presidential debate. A random sample of 340 Republicans is chosen. A random sample of 285 Democrats is chosen. 283 Republicans believe that the Republican candidate won the debate. 205 Democrats feel that the Democratic candidate won the debate. At the 1% level of significance, is there a difference in the proportions of Republicans and Democrats concerning their feelings about whether their party s candidate won the debate? Also, find a 99% confidence interval for the difference in the proportions of the party members concerning whether their party s candidate won the debate. Explain its meaning in the context of the problem.
Full Solution Using PHStat Two Proportion Z test Data Confidence Interval Estimate of the Difference Between Two Proportions Hypothesized Difference Level of Significance 0 0.01 Group 1 Data Number of Items of Interest Sample Size Group 2 Number of Items of Interest 283 340 Confidence Level 99% Intermediate Calculations 205 Z Value Std. Error of the Diff. between two Proportions Interval Half Width -2.5758 Sample Size 285 0.0334 0.0862 Intermediate Calculations Group 1 Proportion Group 2 Proportion Difference in Two Proportions Average Proportion Z Test Statistic 0.832352941 0.719298246 0.113054696 0.7808 3.4027 Confidence Interval Interval Lower Limit Interval Upper Limit 0.0269 0.1992 Two-Tail Test Lower Critical Value Upper Critical Value p-Value Reject the null hypothesis -2.5758 2.5758 0.0007
Additional Information Again, for this and other hypothesis tests, the statement of the statistical decision will not be shown, so that the students have to determine the decisions using the supplied information. Also for this and all hypothesis testing, either the critical value(s) or the p-value may not be shown, so that the student is forced to use what is given to make the decisions, not calculate in order to use what is not given. For the confidence intervals, the confidence limits may be eliminated, making it necessary that students know how confidence intervals are constructed using point estimates and margins of error.
Implications for Teaching ProfessionalsFood for Thought For university professors: Decide if this method would work for you and whether or not it is a better method for you to use than that which you use now. Or decide if parts of what I do are applicable to what you do. Perhaps your decision (and mine) is based upon the kind of student you (and I) teach the quality of the students, the department or college in which your courses are housed, the philosophy of your department and college, and/or the desire for consistency among those teaching the course among other reasons as well as on your personal philosophy. For high school AP teachers: Perhaps you are limited by the AP program as to what you can do in this regard. But that s ok! Would you consider incorporating procedures such as these if you have the time after the administration of the AP exam? Or, if you have other additional times, would you consider, after having taught your students how to accomplish the statistical procedures you teach them in a more mathematical way or with the use of a statistical calculator, using a statistical software package in the manner that I do?
Thanks for Listening! That s all folks!