Watershed Delineation Comparison: USGS vs ESRI Ready-to-Use Method
Explore the comparison between USGS and ESRI Ready-to-Use methods for watershed delineations. Detailed analysis showcases the advantages and drawbacks of each approach, highlighting factors like accuracy, reliability, and efficiency. Get insights into workflow processes, time requirements, and overall performance evaluation.

Download Presentation

Please find below an Image/Link to download the presentation.
The content on the website is provided AS IS for your information and personal use only. It may not be sold, licensed, or shared on other websites without obtaining consent from the author. Download presentation by click this link. If you encounter any issues during the download, it is possible that the publisher has removed the file from their server.
E N D
Presentation Transcript
Watershed Delineations A watershed delineation comparison between the USGS method and the ESRI Ready-to-Use method Emily Pease Masters Student, Energy and Earth Resources (USGS Hydrologist)
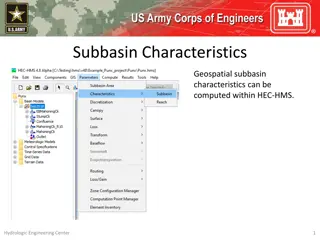
Background: Current USGS method: ESRI s Ready-to-Use method: Tedious Computationally expensive Time-consuming Accurate Reliable Quick-and-easy Computationally inexpensive
Background: Current USGS method: ESRI s Ready-to-Use method: Tedious Computationally expensive Time-consuming Accurate Reliable Quick-and-easy Computationally inexpensive Accurate?? Reliable??
Is the ESRI Ready-to-Use tool reliable? Could it serve as a replacement for the current USGS method?
Workflow (USGS Method) TOTAL TIME = 1 HOUR TO 10+ HOURS DEPENDING ON SIZE
Workflow (ESRI Method) TOTAL TIME = 10 mins or less
Looking at percent differences, overall really great results! Except for two...
Looking at percent differences, overall really great results! Except for two 08098450 08061548 What happened?
Looking at percent differences, overall really great results! Large Except for two 08098450 08061548 What happened?
ESRI watershed area = 27,000 square miles ESRI USGS watershed area = 17,000 square miles USGS Percent difference = 45%
Percent difference = 45% ESRI Why? ESRI included the non- contributing drainage area (Playa Lakes) USGS USGS included only contributing drainage area
Percent difference = 45% ESRI Now why is this an issue? Editing required Less accurate after editing overall + more time needed (and money!) USGS
Looking at percent differences, overall really great results! Except for two Small 08098450 08061548 What happened?
USGS ESRI
ESRI watershed area = 0.04 square miles USGS USGS watershed area = 0.3 square miles Percent difference = 147% ESRI
Percent difference = 147% USGS Why? ESRI resolution is 30m USGS resolution is 10m ESRI
Arithmetic Scale: Mostly one-to-one in size, with the obvious exception of 08098050 TRENDLINE ONE-TO-ONE LINE
Lets zoom in a bit TRENDLINE ONE-TO-ONE LINE
Lets zoom in a bit Clear one-to-one ratio (minimal residuals) in most watersheds
Conclusion Is the ESRI method reliable? No, but it is useful. Can the USGS replace its current method with the ESRI method? No, but it can help the analyst gain a general understanding of the basin area
Conclusion Limitations of the ESRI method: Gives option of 10m resolution, always only uses 30m (not accurate on smaller watersheds) Includes contributing area without an option for separating out non- contributing area Does not include some sinks Pros: Fast, efficient Produces quick-and-easy watershed boundary to quickly visualize basin area


")
")
")
")
")