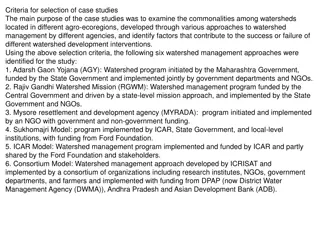
Evaluating Watershed Delineation Discrepancies in West Virginia
This case study explores differences between NRCS Watershed Boundary Dataset and ArcGIS auto delineation in the Upper Guyandotte Watershed in West Virginia. The project aims to quantify discrepancies, analyze landscape characteristics, examine mining impacts, and assess the variations' effects on hydrologic modeling.

Download Presentation

Please find below an Image/Link to download the presentation.
The content on the website is provided AS IS for your information and personal use only. It may not be sold, licensed, or shared on other websites without obtaining consent from the author. Download presentation by click this link. If you encounter any issues during the download, it is possible that the publisher has removed the file from their server.
E N D
Presentation Transcript
Evaluating Watershed Delineation Discrepancies Between the HUC 12 Watershed Boundary Dataset and ArcGIS Auto Delineation Case study: Heavily Mined Landscape in the West Virginia Upper Guyandotte Watershed Cori Edwards
Introduction Watershed delineations provide an important basis for environmental study and watershed management. Introduction Purpose The National Resources Conservation Service (NRCS) developed the Watershed Boundary Dataset (WBD) requiring 1:24,000 spatial accuracy standards used extensively by scientists and within hydrologic models. Data Delineation Process Analysis Geographic Information Systems, such as ArcGIS, contain watershed delineation tools producing boundaries for the same areas that vary compared to the NRCS WBD and may impact environmental models. Conclusion (Stanton, 2001) 2 10/4/2024
Introduction Area of Interest: Introduction Upper Guyandotte HUC 8 containing 22 HUC 12 subwatersheds Purpose Data Delineation Process Analysis Conclusion 3 10/4/2024
Introduction Variance An area in which the NRCS WBD HUC 12 delineations differ from the ArcGIS delineations by 40 feet and encompass at least 5 acres. Introduction Purpose Data Delineation Process Analysis NRCS WBD HUC 12 ArcMap Delineation Conclusion 4 10/4/2024
Purpose Introduction This project will: Purpose 1. Quantify the magnitude of differences between NRCS WBD HUC 12 delineations and ArcGIS delineations. (Variances) Data 2. Determine if patterns exist within Variances and if specific landscape characteristics correlate with these patterns Delineation Process 3. Explore the relationship between Variances and mountaintop removal mining Analysis 4. Examine the impact of watershed variation on hydrologic model analysis specifically, the watershed lag method of calculating time of concentration. Conclusion 5 10/4/2024
GIS Data Required Downloadable Data Introduction NRCS HUC 12 Watershed Boundaries Purpose NRCS Flowlines 2011 NLCD Land Use Data USGS 10 meter NED WV Sheriff Association Aerial Imagery Delineation Process USGS Topographical maps Analysis WV TAGIS LiDAR WV DEP Mining Permitted Boundaries Conclusion 6 10/4/2024
Desktop Delineation 1. Create a depression less elevation raster by filling sinks Introduction Purpose 2. Create a flow direction raster Data 3. Create a flow accumulation raster Delineation Process 4. Create pour points 5. Delineate watersheds Analysis 6. Convert watershed rasters to polygons Conclusion 7 10/4/2024
Quantifying Significant Discrepancies Create Variance features: Introduction Auto Delineation varies from NRCS WBD 12 digit HUCs Purpose The variation extends more than 40 feet from the NRCS standard The variation exceeds 5 acres Data Delineation Process Analysis NRCS WBD HUC 12 Conclusion ArcMap Delineation 8 10/4/2024
Quantifying Significant Discrepancies Apply Buffer: Introduction Purpose NRCS WBD HUC 12 40 foot Buffer Data Delineation Process Analysis Conclusion Restrict to Variances 5 acres 9 10/4/2024
Quantifying Significant Discrepancies Introduction Area (acres) NRCS HUC 12 Area (acres) ArcGIS Delineation Absolute Value Percent Difference Percent NRCS HUC included in ArcGIS Delineation Percent NRCS HUC Underestimated by ArcGIS Delineation Percent NRCS HUC Overestimated by ArcGIS Delineation Positive Variance Count Negative Variance Count Purpose Data Delineation Process Analysis Conclusion 10 10/4/2024
Overall Area Analysis Is the occurrence of total Variance per HUC related to the overall HUC area? Illustrate the degree of correlation using a scatterplot. Introduction Example: Purpose Data HUC12 Area Delineation Process Analysis Number of Variances within each HUC 12 Conclusion (http://pro.arcgis.com/en/pro-app/tool-reference/spatial-statistics/regression-analysis- basics.htm) 11 10/4/2024
Identifying Patterns Introduction Quantify Variance Attributes: Acreage Mean elevation Maximum elevation Minimum elevation Predominant slope aspect Average slope Predominant land use Presence of mining activities Purpose Data Delineation Process Analysis Conclusion 12 10/4/2024
Nominal Data Patterns Introduction Employ histograms to study data frequency for each Variance attribute. Purpose Data Delineation Process Analysis Incorporate box plots to display the median and interquartile range of measurable data including slope. Conclusion 13 10/4/2024
Impact on Time of Concentration Equation Calculate the longest flow path for all HUC 12 subwatersheds, NRCS and ArcMap delineated. Introduction Purpose Data Delineation Process Analysis (NRCS U. , 2010) Calculate the time of concentration using the watershed lag method for five with the largest difference in longest flowpath to demonstrate the effect watershed delineation has on a practical level. Conclusion 14 10/4/2024
Delineations Affected by Mountaintop Removal Highlight the presence and magnitude of Variances within mountaintop removal locations. Introduction Purpose Data Delineation Process Analysis Conclusion (https://www.skytruth.org/issues/mining/#toggle-id-1) 15 10/4/2024
Conclusion Introduction It is hypothesized that: Purpose Discrepancies in auto delineated subwatersheds exceed the 40 foot accuracy standards for over half of the delineations when compared to the HUC 12 boundaries. Patterns will emerge in the areas of greatest discrepancy corresponding to specific land uses, elevations, slopes, and most especially, mining. There exists a positive correlation between HUC size and total number of Variances. Delineation discrepancies produce minor, potentially insignificant, impact on hydrologic analysis and management decisions. Data Delineation Process Analysis Conclusion 16 10/4/2024
References Council, N. R. (1997). Watershed Research in the U.S. Geological Survey. (T. N. Press, Ed.) Retrieved from https://www.nap.edu/read/5589/chapter/5#27 EnviroAtlas. (2017, November 4). Hydrologic Unit Codes: HUC 4, HUC 8, and HUC 12. Retrieved from EnviroAtlas Fact Sheet: https://enviroatlas.epa.gov/enviroatlas/DataFactSheets/pdf/Supplemental/HUC.pdf Environmental Systems Research Institute, I. (2016). ArcMap Flow Direction. Retrieved from http://desktop.arcgis.com/en/arcmap/10.3/tools/spatial-analyst- toolbox/flow-direction.htm#I_ESRI_TOOLILLUSTRATION_A258E137E9EF46ECB02641E2FD4462CE Environmental Systems Research Institute, I. (2016). ArcMap Union. Retrieved from http://desktop.arcgis.com/en/arcmap/10.3/tools/analysis-toolbox/union.htm NRCS. (2007, June 18). Watersheds, Hydrologic Units, Hydrologic Unit Codes, Watershed Approach, and Rapid Watershed Assessments. Retrieved from https://www.nrcs.usda.gov/Internet/FSE_DOCUMENTS/stelprdb1042207.pdf NRCS. (n.d.). Watershed Boundary Dataset (WBD) Overview. Retrieved from History of Hydrologic Units and Supporting Documents: https://www.nrcs.usda.gov/wps/portal/nrcs/detail/national/water/watersheds/dataset/?cid=nrcs143_021623 NRCS, U. (2010). National Engineering Handbook. In U. NRCS, National Engineering Handbook. Retrieved December 2, 2017, from https://policy.nrcs.usda.gov/OpenNonWebContent.aspx?content=27002.wba Sarah Irwin, R. S. (2014). Instruction for Watershed Delineation in an ArcGIS Environment for Regionalization Studies. Water Resources Report, University of Western Ontario, Department of Civil and Environmental Engineering. Retrieved from https://www.eng.uwo.ca/research/iclr/fids/publications/products/87.pdf Stanton, G. P. (2001). A Comparison of Manual and Computer-Assisted Drainage Delineated Methods for Hydrologic-Unit Map Development . Retrieved from http://topsoil.nserl.purdue.edu/nserlweb-old/isco99/pdf/ISCOdisc/SustainingTheGlobalFarm/P047-Stanton.pdf Tetra Tech, U. R. (2009, December 11). Loading Simulation Program in C++ (LSPC) Version 3.1 User Manual. Retrieved November 4, 2017, from http://dpw.lacounty.gov/wmd/wmms/docs/LSPC-UserManual.pdf USGS. (2014, October 20). Hydrography. Retrieved November 4, 2017, from Frequently Asked Questions about the NHD & WBD Datasets: https://nhd.usgs.gov/Frequently+Asked+Questions+about+the+NHD+&+WBD.htm USGS. (2014, October 20). Hydrography. Retrieved from United States Geological Survey: https://nhd.usgs.gov/Frequently+Asked+Questions+about+the+NHD+&+WBD.htm USGS. (2017, November 04). Hydrologic Unit Maps. Retrieved from USGS Website: https://water.usgs.gov/GIS/huc.html Xu, C.-y. (2002). Textbook of Hydrologic Models. Uppsala, Sweden: Uppsala University. Retrieved from http://www.soil.tu- bs.de/lehre/Master.Unsicherheiten/2012/Lit/Hydrology_textbook.pdf 18 10/4/2024