Understanding Processor Generations and VM Sizing for Azure Migration
Exploring the impact of processor generations on CPU performance, factors like clock speed, instruction set, and cache size are crucial. Choosing the right-sized VM plays a vital role in optimizing Azure migration. Passmark CPU Benchmark results provide insights on Intel processor generations for Azure VMs, showcasing performance comparisons and pricing details. Moore's Law sets the pace for transistor density growth in integrated circuits, influencing processor advancements. Consider these factors for efficient cloud migration strategies.

Download Presentation

Please find below an Image/Link to download the presentation.
The content on the website is provided AS IS for your information and personal use only. It may not be sold, licensed, or shared on other websites without obtaining consent from the author. Download presentation by click this link. If you encounter any issues during the download, it is possible that the publisher has removed the file from their server.
E N D
Presentation Transcript
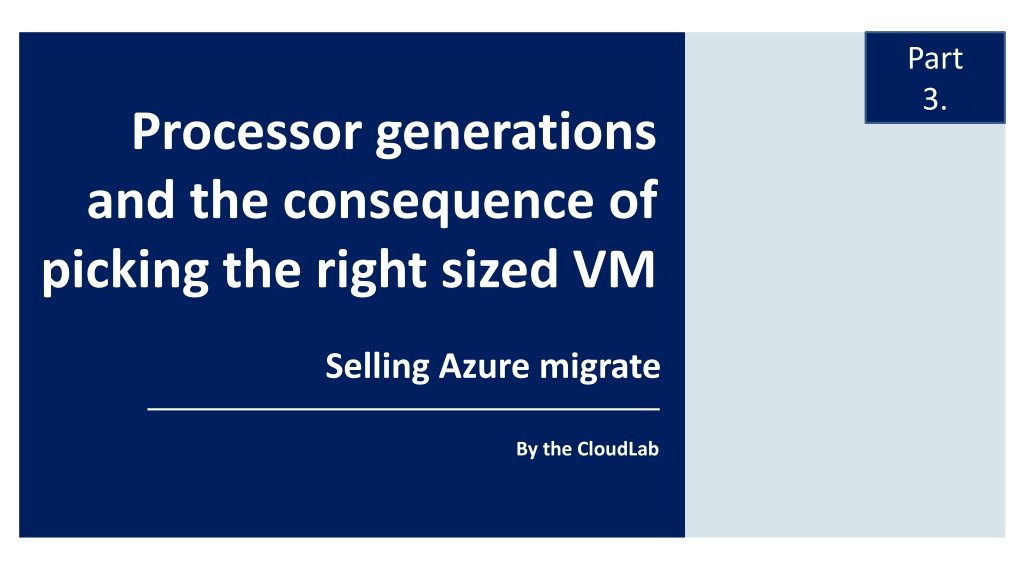
Part 3. Processor generations and the consequence of picking the right sized VM Selling Azure migrate By the CloudLab
Moore's law is the observation that the number of transistors in a dense integrated circuit (IC) doubles about every two years.
Instruction Set This is the processor's built-in code that tells it how to execute its duties. The processor's architecture and instruction set determine how many cycles, or ticks, are needed to execute a given instruction. Multiple cores and multi-threading Processors run two (dual-core) or four (quad-core) times faster than a single processor. Multi threading improves performance by allowing multiple CPUs to work on a problem at the same time but too much multithreading is just as much a problem as too little. Clock Speed The clock speed (or clock rate) is stated in megahertz (MHz) or gigahertz (GHz) and refers to the speed at which the processor can execute instructions. The faster the clock, the more instructions the processor can complete per second. Bandwidth Measured in bits, the bandwidth determines how much information the processor can process in one instruction. The current bandwidth standard is 64 bit Front Side Bus Speed The FSB is the interface between the processor and the system memory. he CPU's FSB speed determines the maximum speed at which it can transfer data to the rest of the system. On-Board cache The on-board (or "on-die") cache is a relatively small amount of high-performance SRAM built directly into the processor, a processor with more onboard cache will outperform a processor with less onboard cache. Looking at all the numbers doesn't always tell the whole story of how well a processor will function in the real world. It's also why when choosing a processor, benchmark tests that measure the chip's abilities to do real-world work can be very useful. Factors affecting CPU performance
Passmark CPU Benchmark results ( Baselines ) are gathered from users submissions to the PassMark web site as well as from internal testing. PerformanceTest conducts different tests and then averages the results together to determine the CPU Mark for a system. Passmark Benchmark rating Passmark CPU Benchmark method
Passmark CPU Benchmark Intel processor generations Azure VM s 60,000 50,000 40,000 30,000 20,000 10,000 0 CPU Performance compared
Size vCPU GiB Temp Storage GB Max Data Disks IOPS/MBps Max NIC s Network Mbps Passmark Rating Price per month* Standard_D14s_v2 16 112 800 64 51200/768 8 12000 14,933 $ 1,081 Standard_E16s_v3 16 128 400 32 24000/375 8 8000 17,533 $ 823 Standard_E16as_v4 16 128 256 32 32000/255 8 8000 53,478 $ 823 Standard_E16ds_v4 16 128 600 32 154000/968 8 8000 42,000** $ 934 Standard_E16s_v4 16 128 0 32 25600/382 8 8000 42,000** $ 823 Price level EU North, bare VM without any OS cost, PAYG, all in USD The E(d)v4 Vms are running a Microsoft specific processor, the Passmark benchmark is an average of three processors of hat same family of processors Azure Memory Optimized VM s compared in more detail
SKU Family ACU vCPU:Core SKU Family ACU vCPU:Core A(m)v2 100 1:1 H(m) 290-300 1:1 D(s)v2 210-250 1:1 HB 199-216 1:1 D(s)v3 160-190 2:1 HC 297-315 1:1 Da(s)v4 230-260 2:1 L(s)v2 150-175 2:1 D(ds)v4 195-210 2:1 F(s) 210-250 1:1 The concept of the Azure Compute Unit (ACU) provides a way of comparing compute (CPU) performance across Azure SKUs. This will help you easily identify which SKU is most likely to satisfy your performance needs. ACU is currently standardized on a Small (Standard_A1) VM being 100 and all other SKUs then represent approximately how much faster that SKU can run a standard benchmark F(s)v2 195-210 2:1 E(s)v3 160-190 2:1 Ea(s)v4 230-260 2:1 E(ds)v4 195-210 2:1 (D(s) 11-15 210-250 1:1 M 160-180 2:1 Mv2 180-280 2:1 Microsoft s own benchmark: Azure Compute Units Important: The ACU is only a guideline. The results for your workload may vary
Azure VM: D8av4 Passmark rating: 53.479 Azure VM 8 cores 32 GBRAM Processor performance GBR/CORE ratio 4 The Passmark benchmark indicates a 3.7 times faster CPU 1. 2. Do you need the same sizing to get the same performance? Do you want to maintain the same GBR/Core ratio? Existing VM sizing 8 cores 32 GBRAM GBR/CORE ratio 4 Intel Haswell Gen. (WinServer 2012) Passmark rating 14.111 Matching an existing VM with an Azure VM
4 cores 32 GBRAM E4av4 $ 205 GBR/CORE ratio 8 4 cores 16 GBRAM D4av4 $ 156 GBR/CORE ratio 4 Processor performance 32 GBRAM 8 cores D8av4 $ 312 GBR/CORE ratio 4 Existing VM sizing 8 cores 32 GBRAM GBR/CORE ratio 4 Intel Haswell Gen. (WinServer 2012) Passmark rating 14.111 Two (of many) possible options to Right Size an existing VM All VM prices based on EU-West region per month and without an OS license