Analysis of Health Conditions Associated with Music Instrument Players
This analysis includes bar plots and PheWAS plots showcasing the number of diagnoses/conditions per Phecode category and conditions associated with various music instrument players such as string, percussionists, keyboard, brass, woodwind, vocalists, and child musicians aged 5 to 17. The plots reveal significant patterns and associations between music instrument players and specific health conditions.

Download Presentation

Please find below an Image/Link to download the presentation.
The content on the website is provided AS IS for your information and personal use only. It may not be sold, licensed, or shared on other websites without obtaining consent from the author. Download presentation by click this link. If you encounter any issues during the download, it is possible that the publisher has removed the file from their server.
E N D
Presentation Transcript
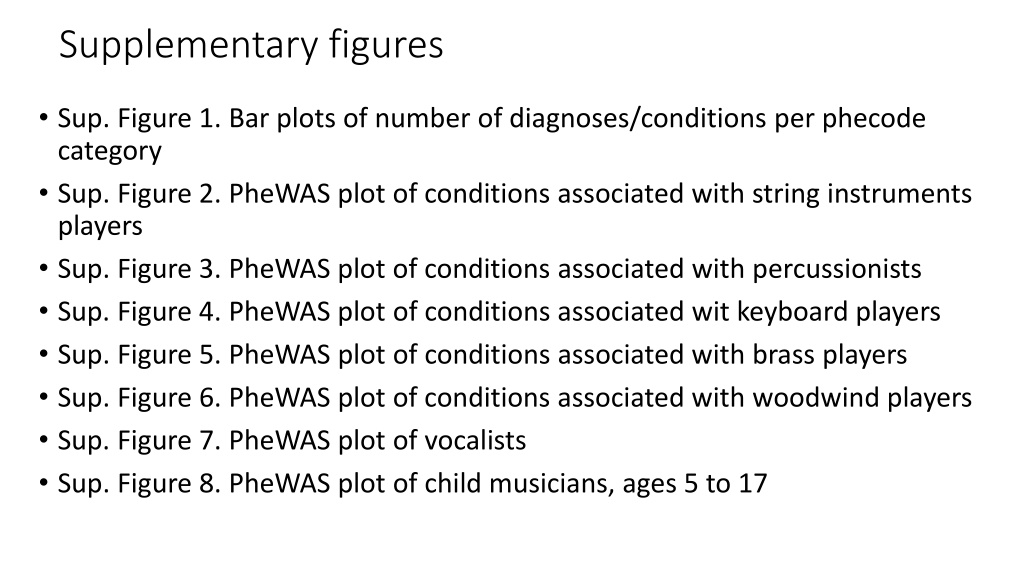
Supplementary figures Sup. Figure 1. Bar plots of number of diagnoses/conditions per phecode category Sup. Figure 2. PheWAS plot of conditions associated with string instruments players Sup. Figure 3. PheWAS plot of conditions associated with percussionists Sup. Figure 4. PheWAS plot of conditions associated wit keyboard players Sup. Figure 5. PheWAS plot of conditions associated with brass players Sup. Figure 6. PheWAS plot of conditions associated with woodwind players Sup. Figure 7. PheWAS plot of vocalists Sup. Figure 8. PheWAS plot of child musicians, ages 5 to 17
Supplementary Figure 1. Bar plots of number of diagnoses/conditions per phenotype category
Supplementary figure 2. PheWAS plot of conditions associated string instrument players (green line represents Bonferroni correction threshold taking into account all analyses (7.6 x 10⁻⁶), red line represents Bonferroni correction threshold based on the specific PheWAS, and blue line represents suggestive significant line)
Supplementary figure 3. PheWAS plot of conditions associated with percussionists (green line represents Bonferroni correction threshold taking into account all analyses (7.6 x 10⁻⁶), red line represents Bonferroni correction threshold based on specific analysis, and blue line represents suggestive significant line)
Supplementary figure 4. PheWAS plot of conditions associated with keyboard players (green line represents Bonferroni correction threshold taking into account all analyses (7.6 x 10⁻⁶), red line represents Bonferroni correction threshold based on specific analysis, and blue line represents suggestive significant line)
Supplementary figure 5. PheWAS plot of conditions associated with brass players (green line represents Bonferroni correction threshold taking into account all analyses (7.6 x 10⁻⁶), red line represents Bonferroni correction threshold based on specific analysis, and blue line represents suggestive significant line)
Supplementary figure 6. PheWAS plot of conditions associated with woodwind players (green line represents Bonferroni correction threshold taking into account all analyses (7.6 x 10⁻⁶), red line represents Bonferroni correction threshold based on specific analysis, and blue line represents suggestive significant line)
Supplementary figure 7. PheWAS plot of conditions associated with vocalists (green line represents Bonferroni correction threshold taking into account all analyses (7.6 x 10⁻⁶), red line represents Bonferroni correction threshold based on specific analysis, and blue line represents suggestive significant line)
Supplementary figure 8. PheWAS plot of conditions associated with child musicians, ages 5 to 17 (green line represents Bonferroni correction threshold taking into account all analyses (7.6 x 10⁻⁶), red line represents Bonferroni correction threshold based on specific analysis, and blue line represents suggestive significant line)


![Explore the Exciting World of Live Music Through [Insert Town/City] Census!](/thumb/148894/explore-the-exciting-world-of-live-music-through-insert-town-city-census.jpg)