Understanding Correlation and Regression in Statistical Analysis
Exploring the concepts of correlation, regression, and hypothesis testing in statistical analysis to assess relationships between variables, determine effect sizes, and interpret results. Key topics include z-scores, comparing means, and the general requirements for applying correlation analysis.
Download Presentation

Please find below an Image/Link to download the presentation.
The content on the website is provided AS IS for your information and personal use only. It may not be sold, licensed, or shared on other websites without obtaining consent from the author. Download presentation by click this link. If you encounter any issues during the download, it is possible that the publisher has removed the file from their server.
E N D
Presentation Transcript
Applied Statistical Analysis EDUC 6050 Week 9 Finding clarity using data
Today 1. Relationships! 2. Correlation and Intro to Regression 3. Chapter 13 in Book 2
Comparing Means Assessing Relationships Is there a relationship between the two variables? - Correlation - Regression Is one group different than the other(s)? - Z-tests - T-tests - ANOVA We look at how much the variables move together We compare the means and use the variability to decide if the difference is significant 3
Correlation It is a whole class of methods Generally used with observational designs Has similar assumptions to t-test Is a measure of effect size Very related (and based on) z-scores Tells us direction and strength of a relationship between two variables 4
Correlation and Z-Scores Z-score is a univariate statistic (only uses info from ONE variable) Correlation is essentially the z-score between TWO variables ? = ???? ? 1 5
Correlation and Z-Scores Z-score is a univariate statistic (only uses info from ONE variable) Correlation is essentially the z-score between TWO variables z-score of variable x ? = ???? ? 1 z-score of variable y 6
General Requirements ID Var 1 Var 2 1 2 3 4 5 6 7 8 8 6 9 7 7 8 5 5 7 2 6 6 8 5 3 5 1.Two or more continuous variables, 2.Not necessarily directional (one causes the other) 7
General Requirements 9 8 7 6 5 Var 2 1.Two or more continuous variables, 2.Not necessarily directional (one causes the other) 3.Linear Relationship (or at least ordinal) 4 3 2 1 0 4 5 6 7 8 9 10 Var 1 8
Hypothesis Testing with Correlation The same 6 step approach! 1. Examine Variables to Assess Statistical Assumptions 2. State the Null and Research Hypotheses (symbolically and verbally) 3. Define Critical Regions 4. Compute the Test Statistic 5. Compute an Effect Size and Describe it 6. Interpreting the results 9
1 Examine Variables to Assess Statistical Assumptions Basic Assumptions 1.Independence of data 2.Appropriate measurement of variables for the analysis 3.Normality of distributions 4.Homoscedastic 10
1 Examine Variables to Assess Statistical Assumptions Basic Assumptions 1.Independence of data 2.Appropriate measurement of variables for the analysis 3.Normality of distributions 4.Homoscedastic Individuals are independent of each other (one person s scores does not affect another s) 11
1 Examine Variables to Assess Statistical Assumptions Basic Assumptions 1.Independence of data 2.Appropriate measurement of variables for the analysis 3.Normality of distributions 4.Homoscedastic Here we need interval/ratio variables 12
1 Examine Variables to Assess Statistical Assumptions Basic Assumptions Multivariate normality (the two variables are jointly normal) 1.Independence of data 2.Appropriate measurement of variables for the analysis 3.Normality of distributions 4.Homoscedastic
1 Examine Variables to Assess Statistical Assumptions Basic Assumptions 1.Independence of data 2.Appropriate measurement of variables for the analysis 3.Normality of distributions 4.Homoscedastic Variance around the line should be roughly equal across the whole line 14
1 Examine Variables to Assess Statistical Assumptions Examining the Basic Assumptions 1.Independence: random sample 2.Appropriate measurement: know what your variables are 3.Normality: Histograms, Q-Q, skew and kurtosis 4.Homoscedastic: Scatterplots 15
2 State the Null and Research Hypotheses (symbolically and verbally) Hypothesis Type Symbolic Verbal Difference between means created by: ? 0 Research Hypothesis There is a relationship between the variables True relationship ? = 0 Null Hypothesis There is no real relationship between the variables. Random chance (sampling error) 16
How much evidence is enough to believe the null is not true? 3 generally based on an alpha = .05 Define Critical Regions 17
4 Compute the Test Statistic Click on Correlation Matrix 18
4 Compute the Test Statistic Results Bring variables to be correlated over here 19
4 Compute the Test Statistic Average of X Average of Y Y X 20
4 Compute the Test Statistic Average of X If more points are in the green than not, then correlation is positive Average of Y Y X 21
4 Compute the Test Statistic Average of X Average of Y Y If more points are in the red than not, then correlation is negative X 22
One of the main effect sizes for correlation is r2 5 Compute an Effect Size and Describe it ? ?= ?? ? ? Estimated Size of the Effect Small Moderate Large Close to .01 Close to .09 Close to .25 23
Put your results into words 6 Interpreting the results Use the example around page 529 as a template 24
Intro to Regression 25
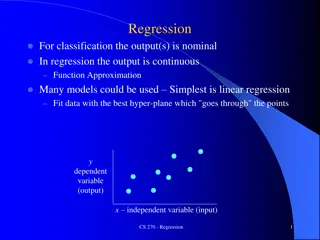
Intro to Regression The foundation of almost everything we do in statistics Comparing group means Assess relationships Compare means AND assess relationships at the same time Can handle many types of outcome and predictor data types Results are interpretable 26
Two Main Types of Regression Simple Multiple Only one predictor in the model When variables are standardized, gives same results as correlation When using a grouping variable, same results as t-test or ANOVA More than one variable in the model When variables are standardized, is close to partial correlation Predictors can be any combination of categorical and continuous 27
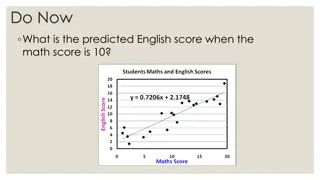
Logic of Regression We are trying to find the best fitting line Y X 28
Logic of Regression We are trying to find the best fitting line We do this by minimizing the difference between the points and the line (called the residuals) Y X 29
Logic of Regression Average of X Line always goes through the averages of X and Y Average of Y Y X 30
Questions? Please post them to the discussion board before class starts End of Pre-Recorded Lecture Slides 31
In-class discussion slides 32
https://www.youtube.com/watc h?v=sxYrzzy3cq8
How Correlation Works Average of X Average of Y Y X 34
How Regression Works We are trying to find the best fitting line We do this by minimizing the difference between the points and the line (called the residuals) Y X 35
Application Example Using The Office/Parks and Rec Data Set Hypothesis Test with Correlation 36
