Challenges and Solutions in Rainfall Observation: A Comprehensive Overview

This report delves into the challenges faced in rainfall observation, such as lack of skilled experts, absence of real-time reporting, and limited knowledge in quality control. It also covers topics like annual rainfall maps, major rainfall-related disasters, rain gauge networks, and applications of observation data. Detailed descriptions and visuals provide insights into improving the quality management of rainfall observation.

Download Presentation

Please find below an Image/Link to download the presentation.
The content on the website is provided AS IS for your information and personal use only. It may not be sold, licensed, or shared on other websites without obtaining consent from the author. Download presentation by click this link. If you encounter any issues during the download, it is possible that the publisher has removed the file from their server.
E N D
Presentation Transcript
Country Status of quality management in rainfall observation Presenter s name Presenter s name Country report in RAII WIGOS workshop on quality management of observation held in Tokyo, March 2018
1. Challenges in rainfall observation Lack of the skilled experts for the maintenance to keep the accuracy of rainfall observation Absence of real-time observation report Little knowledge for the quality control after the observation In this slide, please appeal the challenges / difficulties you feel in rainfall observation. And in the following part of this report, please describe in detail when the topic relates to the above challenges / difficulties.
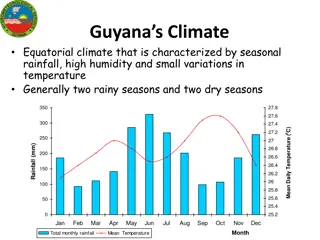
2. Annual rainfall map Monthly rainfall in City AAA Monthly rainfall in City BBB Annual average rainfall map and monthly average rainfall graphs at some characteristic cities are to be placed in this slide.
3. Major recent rainfall-related disaster 201x-Month-Day date of disaster Landslide, flood type of disaster North of ZZZZ area of country or City name Max over 500mm rainfall in 24hour , area average 300mm in 2days rainfall amount Over 5000 people killed, over 10000 houses destroyed number of damage Outline of major recent rainfall- related disaster is to be described in here. If available, a rainfall map is one of preferable materials.
4. Rain gauge network Blue circles represent the automatic rain gauge stations. Tipping bucket rain gauge is used in the station. It observes rainfall every 10 minutes and transmit the data every 1 hour. Minimum observation unit is 0.2mm. Statistical data are stored since April 2004. Rain gauge network map and the type of rain gauge are to be described in this slide. Other essential information (frequency of observation and report, minimum observation unit, period of statistical data) are also to be described. If radar observation is available, it is also to be described in this map. Red circles represent the manned rain gauge stations. Conical graduated cylinder is used in manned station. Observers read the rainfall value every 6 hour and report the data once a day. Minimum observation unit is 0.5mm. Statistical data are stored since October 1980.
5. Applications and users In this slide, it should be described how the observation data are sent to the user and how the data are utilized. XXX s headquarters Manned observed rain gauge data are reported to headquarters once a day. Automatic rain gauge data are transmitted to headquarters every 1 hour. Warning/Watch/Advisory for the stakeholder Monthly rainfall map for the agricultural organization of government Data center in headquarters conducts AQC and archiving statistical data. Observation data in real- time web for the nations Agricultural instruction for the nations
6. Quality management conduct following quality management operations. Rain gauge inspection once a year Site environmental check once in every two years Daily site appearance check Limited value check for the observation data Training course for the observer In this slide, please appeal your operations for the quality management of rainfall observation data.
7. Expectation for this workshop Knowing how to adopt quality management Getting some skills of quality control for observation data Getting some tools of AQC and HQC Getting some materials for lecturing about quality management in my office Making firm relationships between participants to exchange useful information after the workshop In this slide, please describe what you expect to acquire in this workshop.