The Power of Technology in Statistics Education
Explore the significance of using the TI-83/84 graphing calculator and Excel in statistics education to enhance understanding, interpretation, and visualization of data. Emphasizing the importance of technology as a tool for conceptual exploration rather than mere computation, the article delves into the integration of technology in teaching AP Statistics and the American Statistical Association's perspective on utilizing technology for data analysis and interpretation.

Download Presentation

Please find below an Image/Link to download the presentation.
The content on the website is provided AS IS for your information and personal use only. It may not be sold, licensed, or shared on other websites without obtaining consent from the author. Download presentation by click this link. If you encounter any issues during the download, it is possible that the publisher has removed the file from their server.
E N D
Presentation Transcript
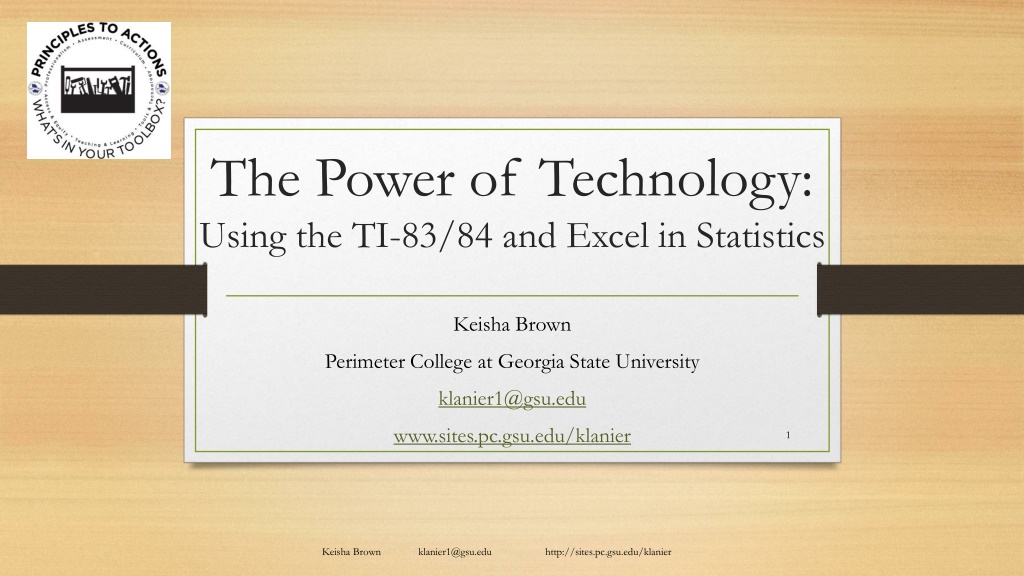
The Power of Technology: Using the TI-83/84 and Excel in Statistics Keisha Brown Perimeter College at Georgia State University klanier1@gsu.edu www.sites.pc.gsu.edu/klanier 1 Keisha Brown klanier1@gsu.edu http://sites.pc.gsu.edu/klanier
Why the TI-84 AND Excel? AP Statistics College Board A graphing calculator is a useful computational aid, particularly in analyzing small data sets, but should not be considered equivalent to a computer in the teaching of statistics. Because the computer is central to what statisticians do, it is considered essential for teaching the AP Statistics course. However, it is not yet possible for students to have access to a computer during the AP Statistics Exam. The computer does more than eliminate the drudgery of hand computation and graphing it is an essential tool for structured inquiry. 2 Keisha Brown klanier1@gsu.edu http://sites.pc.gsu.edu/klanier
Why the TI-84 AND Excel? American Statistical Association s GAISE We think technology should be used to analyze data, allowing students to focus on interpretation of results and testing of conditions, rather than on computational mechanics. Technology tools should also be used to help students visualize concepts and develop an understanding of abstract ideas by simulations. Regardless of the tools used, it is important to view the use of technology not just as a way to compute numbers but as a way to explore conceptual ideas and enhance student learning as well. We caution against using technology merely for the sake of using technology (e.g., entering 100 numbers in a graphing calculator and calculating statistical summaries) or for pseudo-accuracy (carrying out results to multiple decimal places). 3 Keisha Brown klanier1@gsu.edu http://sites.pc.gsu.edu/klanier
Indeed.com Search for Excel Search for Graphing Calculator 8,379 Keisha Brown klanier1@gsu.edu http://sites.pc.gsu.edu/klanier 4
What Other Tools Are Out There? Statcrunch Tinkerplots Tableau Excel Add-Ins Tablet Apps Fathom Codap TuvoLabs NZGrapher Plotly Infographic source: http://www.predictiveanalyticstoday.com/top-statistical-software/ Keisha Brown klanier1@gsu.edu http://sites.pc.gsu.edu/klanier 5
Before you begin, you need to check: Graphing Calculator What operating system do they have? 2nd, plus (MEM), 1:About TI-84 Plus CE 5.1.5 TI-84 Plus, TI-84 Plus Silver Edition 2.55MP is the newest operating system Is their StatWizard off or on? Excel Do they have a PC or a Mac? Which version of Excel do they have? Do they have the Data Analysis Tool Pak installed? File, Options, Add-Ins, Go Keisha Brown klanier1@gsu.edu http://sites.pc.gsu.edu/klanier 6
How to import/enter/share your data Graphing Calculator Excel Video Or manually type it in Keisha Brown klanier1@gsu.edu http://sites.pc.gsu.edu/klanier 7
Random Sampling Excel 2013 =rand() =randbetween(min, max) Data Tab, Data Analysis, Random Number Generation TI-83/84 Randomly select and set a seed. (I chose 34.) Select your sample. Keisha Brown klanier1@gsu.edu http://sites.pc.gsu.edu/klanier 8
Descriptive Statistics Mean, Sample Standard Deviation, Population standard deviation, 5 Number Summary (min, Q1, Q2, Q3, max) TI-84 Stat, CALC, 1:1-Var Stats, (Select List - OPTIONAL) Excel Type individual function names Mean = average(data) Or Data, Data Analysis, Descriptive Statistics *Make sure to select Summary Statistics* Keisha Brown klanier1@gsu.edu http://sites.pc.gsu.edu/klanier 9
Graphs for One Variable Histogram, Box Plot with Outliers, Box Plot Without Outliers, Dot Plot, Stem and Leaf Plot TI-84 Excel *Data, Data Analysis, Histogram* Right click on a bar for format data series N/A N/A Histogram Box Plot with Outliers Box Plot without Outliers Bar Chart Pie Chart Dot Plot, Stem and Leaf Plot, Normal Probability Plots N/A N/A N/A Insert, Column Chart Insert, Pie Chart N/A Data, Data Analysis, Regression Select Normal Probability Plot at the bottom Keisha Brown klanier1@gsu.edu http://sites.pc.gsu.edu/klanier 10
Bivariate Data TI-84 Excel Turn on Diagnostic, so students will see the additional menus. 2nd, 0 (Catalog), DiagnosticOn ScatterPlot Highlight your columns first. Insert, Scatterplot. =correl(x, y) =rsq(y, x) =slope(y, x) =intercept(y,x) OR DATA, Data Analysis, Regression r, r2, least squares regression line Stat, Calc, 4:LinReg(ax+b) Keisha Brown klanier1@gsu.edu http://sites.pc.gsu.edu/klanier 11
Probability Distributions Discrete TI-83/84 For the new operating system, make sure the STATWIZARDS are off Stat, 1:1-Var Stats L1, L2 Excel Link Keisha Brown klanier1@gsu.edu http://sites.pc.gsu.edu/klanier 12
Probability Distributions Binomial TI-83/84 Excel Binompdf(n, p, x) What is the probability of getting x successes from n trials with a probability of success p? 1.) What is the probability of getting a 100 on a 10 question multiple choice (A D) quiz that you did not study for? 2.) What is the probability of failing this quiz? Binomcdf(n, p, x) What is the probability of getting x or less successes from n trials with a probability of success p? 3.) What is the probability of scoring between a 70 and 90, inclusive? Keisha Brown klanier1@gsu.edu http://sites.pc.gsu.edu/klanier 13
Probability Distributions Normal Excel TI-83/84 Normalcdf(lowerlimit, upper limit, mean, std. dev.) invNorm(area to the left, mean, std. dev.) Keisha Brown klanier1@gsu.edu http://sites.pc.gsu.edu/klanier 14
Probability Distributions Students t Distribution TI-83/84 Excel To find the probability Tcdf(lower limit, upper limit, df) To find the probability =t.dist(test statistic, df, true) To find the critical values invT( , df) To find the critical values t.inv( , df) Keisha Brown klanier1@gsu.edu http://sites.pc.gsu.edu/klanier 15
Confidence Intervals (Means) TI-84 Stat, TESTS, Z-interval Excel *Gives the margin of error* =confidence.norm( , , n) *Gives the margin of error* =confidence.t(alpha, s, n) Confidence Interval for a Population Mean ( is known) Confidence Interval for a Population Mean ( is NOT known and normal population) Confidence Interval for a Difference between means (unpaired)(????? ?? are known) Stat, TESTS, T-interval Stat, TESTS, 2-SampZInt Confidence Interval for a Difference between means (unpaired) (??= ?? and are unknown) Stat, TESTS, 2-SampTInt (pool the variance) Confidence Interval for a Difference between means (unpaired) (?? ?? and are unknown) Stat, TESTS, 2-SampTInt (do not pool the variances) Confidence Interval for a Difference between means (paired) Manual Put data in L1 and L2. In L3, calculate the difference. Stat, TESTS, T-interval(L3) Keisha Brown klanier1@gsu.edu http://sites.pc.gsu.edu/klanier 16
Confidence Intervals (Proportions and Slope) TI-84 Stat, TESTS, 1-PropZInt Excel Manual Confidence Interval for a Population Proportion (p) Confidence interval of the difference of two independent proportions Stat, TESTS, 2-PropZInt Confidence Interval for the slope of a least-squares regression line LinRegTInt Data, Data Analysis, Regression *Make sure to select the Confidence Level Keisha Brown klanier1@gsu.edu http://sites.pc.gsu.edu/klanier 17
Hypothesis Testing (Means and Proportions) TI-84 Stat, TESTS, Z-test Excel Hypothesis Testing For a Population Mean ( is known) n 30 Hypothesis Testing For a Population Mean ( is unknown) n 30 Hypothesis Testing For a 2 Independent Means ( 1 and 2is known) n1 and n2 30 Hypothesis Testing with 2 Independent Means ( 1 and 2 are unknown) Stat, TESTS, T-test Stat, TESTS, 2-SampZTest DATA, Data Analysis, z-Test: Two-Sample Means Stat, TESTS, 2-SampTTest =t.test(array1, array2, tails, type) Tails = 1 if a one-sided test, 2 if two-sided test Type = 2 if two-sample equal variance(homoscedastic), 3 if two-sample unequal variance (heteroscedastic) OR DATA, Data Analysis, t-Test: Two-Sample Assuming Unequal Variances OR DATA, Data Analysis, t-Test: Two-Sample Assuming Equal Variances =t.test(array1, array2, tails, type) If 1 = 2, pooled variances = yes If 1 2, pooled variances = no Hypothesis Testing with 2 Dependent Means Put data in L1 and L2. Calculate the difference in L3. Stat, TESTS, T- Test(L3) Tails = 1 if a one-sided test, 2 if two-sided test Type = 1 OR DATA, Data Analysis, t-Test: Paired Two-Sample for Means 18
Hypothesis Testing (Proportions) TI-84 Hypothesis Testing For a Population Proportion Stat, TESTS, 1-PropZTest Excel Manual Hypothesis Testing with 2 Population Proportions Stat, TESTS, 2-PropZTest Keisha Brown klanier1@gsu.edu http://sites.pc.gsu.edu/klanier 19
Hypothesis Testing (Others) TI-84 Chi-Square Test of Independence Stat, TESTS, ?2 ???? Excel =chisq.test(observed, expected) Stat, TESTS, ?2??? ???? Chi-Square Goodness of Fit Test *** =chisq.test(observed, expected) L1: Observed Counts L2: Expected Counts Stat, TESTS, 2-SampFTest Hypothesis Tests for Variance *Data with the largest variance goes in list 1. ANOVA (3 or more s) Data, Data Analysis, F-Test Two-Sample for Variance Stat, TESTS, Anova( *Data, Data Analysis, ANOVA: Single Factor *Data, Data Analysis, ANOVA: Two-Factor with Replication *Data, Data Analysis, ANOVA: Two-Factor without Replication Data, Data Analysis, Regression Make sure to select the Confidence Level Test for the slope of a least-squares regression line Stat, TESTS, LinRegTTest Keisha Brown klanier1@gsu.edu http://sites.pc.gsu.edu/klanier 20


")
")
")
")
")