Engaging Statistics Education Seminar Insights

Seminar insights from The Washington Statistical Society featuring discussions on modern introductory statistics courses, teaching data science precursors, technology integration, and more. Seminar speakers covered topics outlining innovative approaches to statistics education.
- Statistics Education
- Washington Statistical Society
- Seminar Insights
- Data Science
- Technology Integration

Download Presentation

Please find below an Image/Link to download the presentation.
The content on the website is provided AS IS for your information and personal use only. It may not be sold, licensed, or shared on other websites without obtaining consent from the author. Download presentation by click this link. If you encounter any issues during the download, it is possible that the publisher has removed the file from their server.
E N D
Presentation Transcript
Introductory Statistics at the College Level Making it More Exciting and Relevant Elizabeth Johnson, George Mason University; Stephanie Talbot, Montgomery College, Rockville Campus; Bonnie Kegan, U.S. Census Bureau, University of Maryland, Baltimore County and Anne Arundel Community College Washington Statistical Society Seminar February 2, 2015
Next Statistics Education Seminar Teaching precursors to data science in introductory and second courses in statistics Nicholas J. Horton, Professor of Statistics, Amherst College Tuesday, April 28, 2015 At Mathematica Policy Research RSVP & More Details: Carol Joyce Blumberg at cblumberg@gmail.com
How to Get WSS Statistics Education Announcements Contact Carol Joyce Blumberg at cblumberg@gmail.com to be added to a blinded email list. Advantage I send out seminar announcements as soon as they are ready and notices of a few other important statistics education events.
Joining WSS and American Statistical Association (ASA) WSS http://www.washstat.org/joinus.html. If not an ASA member, scroll down to Associate Member part near the bottom of the page. ASA https://www.amstat.org/membership/becomea member.cfm K-12 Teachers Special ASA 3-Month Free Trial Membership. For details, see https://www.amstat.org/membership/k12teache rs/index.cfm?fuseaction=main
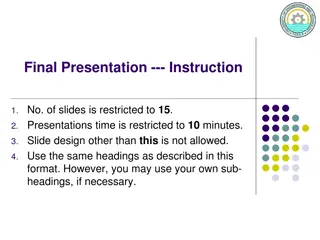
Organization of the Seminar Speakers discuss what Topics should be covered in a modern introductory statistics course, as opposed to traditional one (< 20 min.) Audience questions on Topics only (< 5 min.) Speakers discuss use of Technology in modern introductory statistics course (< 39 min.) Audience Discussion Reception at East Street Caf (mezzanine level of Union Station)
Disclaimer The recommendations in this seminar are solely those of the presenters and not of the Washington Statistical Society or the American Statistical Association
Topics Covered Order of Speakers Stephanie Talbot Bonnie Kegan Elizabeth Johnson
General Statistics Course Content I agree with the outline provided of topics covered in an elementary statistics course but would like us to consider the addition of the Binomial Distribution
Some talking points for addition of Binomial Distribution Allows for investigation of discrete variables Students are familiar with everyday binomial questions Intuitive to students Extending the analysis of binomial distributions through the approximation by the Normal distribution ( a nice connection to make)
How the Content Should be Changed Focus on 4 major areas: Best practices for data collection Describing the data- graphically and numerically Probability/Normal Distribution Making data based conclusions
Best Practices for Data Collection It is important for students to understand where the data come from and how to assess data quality Studies show .. Students need to be taught to question the methods used to collect data to identify potential bias and to understand the role sample size plays Also worthwhile to discuss the role measurement plays in producing valid and reliable data
Describing the data Students need to understand the pros/cons of different graphs and numerical summaries as well as how to select the appropriate graph or summary for the type of data they have and the purpose of the analysis Discussion of stem and leaf plots is unnecessary
Probability Students really need only a basic understanding of probability Relative frequency Probability distribution models Basic addition property Understanding complements (and thus mutually exclusive events)
Normal distribution Understanding the normal distribution is an important foundation for later discussions of inference- agree with standard coverage of this topic. Discussion of sampling distributions and the Central Limit Theorem could be eliminated
Making Data-based Conclusions A discussion of the logic of hypothesis testing is critical-even if students never learn how to calculate a test-statistic or a p-value. Limitations of inference and the impact of sample size on the conclusions that can be made should also be emphasized. I have never taught the Wilcoxon Rank Sum Test to intro students.
Innovations? Recently textbooks and applets have been developed that use randomization and bootstrapping techniques in introductory statistics classes. Statistics educators such as Nathan Tintle ,Beth Chance, Allan Rossman, Jill VanderStoep, Patti Frazer Lock, Robin Lock, Kari Lock Morgan, Webster West, Roger Woodard and Christine Franklin along with others have developed computer software packages and textbooks that allows the language of statistical inference to be taught at the beginning of an introductory statistics course instead of at the end.
What is the appeal? Traditional t test Data collection and experimental design Basic graphics Summary Statistic: means and standard deviations The normal distribution Calculate probabilities Use normal table Sampling distributions and the Central Limit Theorem Distribution of the statistic Basics of Hypothesis testing What is a p-value Hypothesis T-distribution and t-test Using the t-table Randomization tests Data collection and experimental design Basic graphics Summary Statistic - mean
How should topics be sequenced? Lock and others suggest one way is to Start with data production - experiments, random samples, etc. Summarize with statistics and graphs Interval estimation (via bootstrap) Significance tests (via randomizations) Traditional approximations - normal, t-intervals, etc. More advanced inference - ANOVA, two-way tables, etc.
Another suggestion - introduce one parameter at a time? Rossman, Chance and others suggest that students could study one scenario from beginning to end of statistical investigation process Repeat (spiral) through various data scenarios as the course progresses
Concerns How do you train teachers to use these new techniques? How do you assess your students? Do these methods increase understanding or just add to their confusion? If this is a service course, do the other departments only want the traditional approaches taught? If so that may cause other departments to develop their own introductory statistics courses
Technology Order of Speakers Bonnie Kegan Elizabeth Johnson Stephanie Talbot
Role of Technology For students who find mathematics difficult use of technology plays an important role in making statistics more accessible. Options Statcrunch (www.statcrunch.com) Graphing Calculators Excel
Role of Non-lecture Teaching Methods To learn statistics, students have to DO statistics. Students should be given hands on opportunities to Collect data, choose a sample, plan an experiment Formulate a research question and identify the key variables Describe variable distributions graphically and numerically Determine appropriate inference and interpret the results in a meaningful way.
Role of Non-lecture Teaching Methods Students should be allowed to work in small groups Students should be given the opportunity to talk statistics in a presentation or paper. Biggest challenge: choosing activities that align with course objectives and grab student s interest.
STATCRUNCH HIGHLIGHTS Data can be uploaded from a file or you can use the drag and drop feature for files. Surveys can be created and the results easily viewed in the data table for analysis Data, analysis results, surveys and reports can all be saved and shared. Students can create and join groups to share data, results, reports, and surveys
Role of Non-lecture Teaching Methods To learn statistics, students have to DO statistics. Students should be given hands on opportunities to Collect data, choose a sample, plan an experiment Formulate a research question and identify the key variables Describe variable distributions graphically and numerically Determine appropriate inference and interpret the results in a meaningful way.
Content and Technology Changes in Introductory Statistics Classes While many of the basic topics covered in introductory courses has not changed over the past 30 years, the method in which these topics is taught has changed drastically. In my first college level business statistic course (many, many years ago) we did not have computer assignments or powerful hand-held calculators so all calculations were done by-hand using tables lots of tables! So we learned all the calculations but we may have lacked obtaining a solid conceptual understanding of these topics.
Calculators, Computers and the Internet--Oh my! The introduction of technology shifted the classroom focus to teaching students how to use different technologies to perform the calculations. But we still had to teach the tables how else could we assess their skills and assign a course grade? This doubled our work and still did not leave time to stress the issue of conceptual understanding of statistical ideas. Some schools therefore decided to teach the introductory statistics class using two levels a lower level class that stressed conceptual understanding (but with very little math ) AND an upper level class that focused more on the math and computing. Can we have both??
How? Teaching the concepts with applets There are many nicely developed programs, such as http://www.lock5stat.com/statkey/index.html http://math.hope.edu/isi/ http://www.statcrunch.com/ MUST ALWAYS MAKE THE CONNECTION BETWEEN THE STUDY AND THE SIMULATION SO STUDENTS DO NOT FORGET THE POINT OF THE ACTIVITY
Making Statistics understandable and believable using technology Fathom software has now become share ware and provides an ideal platform for elementary statistics students to investigate data. Demo on Fathom : Sampling distributions really understanding and believing the power of sampling distributions in estimating population parameters.
How to Get Fathom Fathom is free of cost until at least June 2015. Go to: http://concord.org/fathom- dynamic-data-software
Tinkerplots Tinkerplots is shareware equivalent of Fathom for elementary and middle school students Used in introductory statistics courses for elementary and middle school teachers Download url: http://www.tinkerplots.com/download