Understanding Dimension Reduction Techniques in Data Analysis


Dimension Reduction
PCA, tSNE, UMAP, Integration
v2024-02
Simon Andrews
simon.andrews@babraham.ac.uk


Where are we heading?
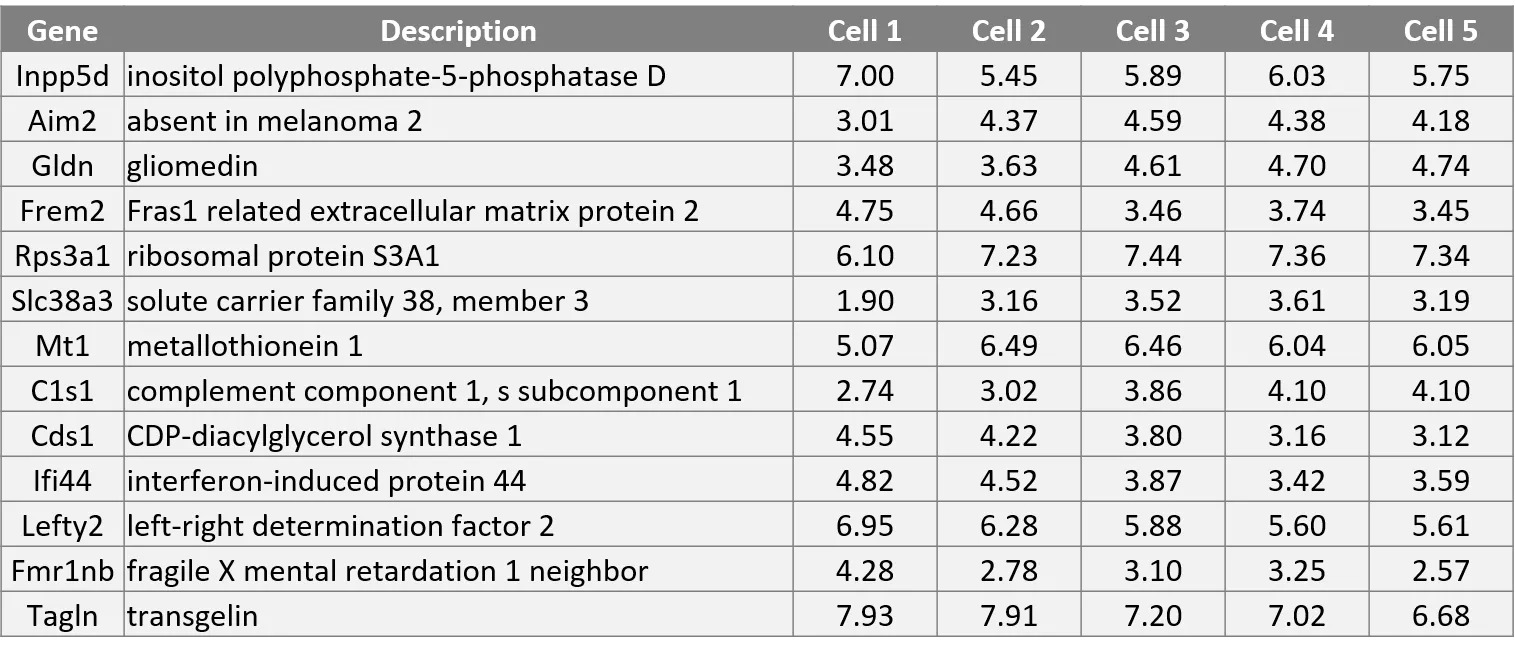
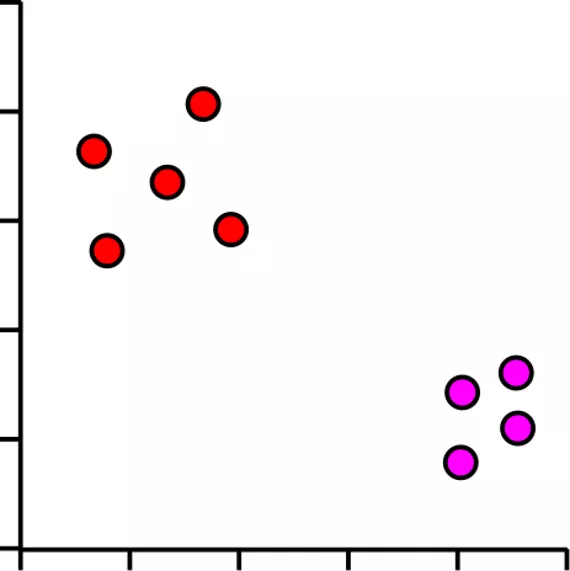
Each dot is a cell
Groups of dots are similar cells
Separation of groups could be interesting biology
Too much data!
•
5000 cells and 2500 measured genes
•
Realistically only 2 dimensions we can plot (x,y)
Principle Components Analysis
•
Method to optimally summarise large multi-dimensional datasets
•
Can find a smaller number of dimensions (ideally 2) which retain
most of the useful information in the data
•
Builds a recipe for converting large amounts of data into a single
value, called a Principle Component (PC), eg:
PC = (GeneA*10)+(GeneB*3)+(GeneC*-4)+(GeneD*-20)…
Principle Components Analysis
•
Method to optimally summarise large multi-dimensional datasets
•
Can find a smaller number of dimensions (ideally 2) which retain
most of the useful information in the data
•
Builds a recipe for converting large amounts of data into a single
value, called a Principle Component (PC), eg:
PC = (GeneA*
10
)+(GeneB*
3
)+(GeneC*
-4
)+(GeneD*
-20
)…
How does PCA work?
Simple example using 2 genes and 10 cells
How does PCA work?
Find line of best fit, passing through the origin
Assigning Loadings to Genes
Single Vector or
‘
eigenvector
’
Loadings:
•
Gene1 = 0.82
•
Gene2 = 0.57
Higher loading equals
more influence on PC
More Dimensions
•
The same idea extends to larger
numbers of dimensions (n)
•
First PC rotates in (n-1) dimensions
–
Next PC is perpendicular to PC2, but
rotated similarly (n-2)
–
Last PC is remaining perpendicular
(no choice)
–
Same number of PCs as genes
Explaining Variance
•
Each PC always explains some proportion of the total variance
in the data. Between them they explain everything
–
PC1 always explains the most
–
PC2 is the next highest etc. etc.
•
Since we only plot 2 dimensions we’d like to know that these
are a good explanation
•
How do we calculate this?
Explaining variance
•
Project onto PC
•
Calculate distance to the origin
•
Calculate sum of squared
differences (SSD)
–
This is a measure of variance called
the ‘eigenvalue’
–
Divide by (points-1) to get actual
variance
PC1
PC2
Explaining Variance – Scree Plots
So PCA is great then?
Kind of…
Non-linear separation of values
So PCA is great then?
Kind of…
Not optimised for 2-dimensions
tSNE to the rescue…
•
T-Distributed Stochastic Neighbour Embedding
•
Aims to solve the problems of PCA
–
Non-linear scaling to represent changes at different levels
–
Optimal separation in 2-dimensions
How does tSNE work?
•
Based around all-vs-all table of pairwise cell to cell distances
Distance scaling and perplexity
•
Perplexity = expected number of neighbours within a cluster
•
Distances scaled relative to perplexity neighbours
Perplexity Robustness
tSNE Projection
•
Randomly scatter all points within the space (normally 2D)
•
Start a simulation
–
Aim is to make the point distances match the distance matrix
–
Shuffle points based on how well they match
–
Stop after fixed number of iterations, or
–
Stop after distances have converged
tSNE Projection
•
X and Y don’t mean anything (unlike PCA)
•
Distance doesn’t mean anything (unlike PCA)
•
Close proximity is highly informative
•
Distant proximity isn’t very interesting
•
Can’t rationalise distances, or add in more data
tSNE Practical Examples
https://distill.pub/2016/misread-tsne/
Perplexity Settings Matter
tSNE Practical Examples
https://distill.pub/2016/misread-tsne/
Cluster Sizes are Meaningless
Original
tSNE Practical Examples
https://distill.pub/2016/misread-tsne/
Distances between clusters can’t be trusted
Original
So tSNE is great then?
•
Now 3 genes
•
Now 3,000 genes
•
Everything is the same
distance from everything
Distance within cluster = low
Distance between clusters = high
Distance within cluster = higher
Distance between clusters = lower
Kind of…
Imagine a dataset with only one super informative gene
So everything sucks?
•
PCA
–
Requires more than 2 dimensions
–
Expects linear relationships
•
tSNE
–
Can’t cope with noisy data
–
Loses the ability to cluster
Answer: Combine the two methods, get the best of both worlds
•
PCA
–
Good at extracting signal from noise
–
Extracts informative dimensions
•
tSNE
–
Can reduce to 2D well
–
Can cope with non-linear scaling
This is what many pipelines do in their default analysis
So PCA + tSNE is great then?
Kind of…
•
tSNE is slow. This is probably it’s biggest crime
–
tSNE doesn’t scale well to large numbers of cells (10k+)
•
tSNE only gives reliable information on the closest neighbours large
distance information is almost irrelevant
UMAP to the rescue!
•
UMAP is a replacement for tSNE to fulfil the same role
•
Conceptually very similar to tSNE, but with a couple of relevant
(and somewhat technical) changes
•
Practical outcome is:
–
UMAP is quite a bit quicker than tSNE
–
UMAP can preserve more global structure than tSNE*
–
UMAP can run on raw data without PCA preprocessing*
–
UMAP can allow new data to be added to an existing projection
* In theory, but possibly not in practice
UMAP differences
•
Instead of the single perplexity value in tSNE, UMAP defines
–
Nearest neighbours
: the number of expected nearest neighbours – basically
the same concept as perplexity
–
Minimum distance
: how tightly UMAP packs points which are close together
•
Nearest neighbours will affect the influence given to global vs local
information. Min dist will affect how compactly packed the local
parts of the plot are.
UMAP differences
•
Structure preservation – mostly in the 2D projection scoring
tSNE
UMAP
https://towardsdatascience.com/how-exactly-umap-works-13e3040e1668
So UMAP is great then?
Kind of…
So UMAP is all hype then?
No, it really does better for some datasets…
3D mammoth skeleton projected into 2D
tSNE:
Perplexity 2000
2h 5min
UMAP:
Nneigh 200, mindist 0.25, 3min
https://pair-code.github.io/understanding-umap/
Practical approach PCA + tSNE/UMAP
•
Filter heavily before starting
–
Nicely behaving cells
–
Expressed genes
–
Variable genes
•
Do PCA
–
Extract most interesting signal
–
Take top PCs. Reduce dimensionality (but not to 2)
•
Do tSNE/UMAP
–
Calculate distances from PCA projections
–
Scale distances and project into 2-dimensions
So PCA + UMAP is great then?
Kind of… as long as you only have one dataset
–
In 10X every library is a 'batch'
–
More biases over time/distance
–
Biases prevent comparisons
–
Need to align the datasets
Data Integration
•
Works on the basis that there are 'equivalent' collections of
cells in two (or more) datasets
•
Find 'anchor' points which are equivalent cells which should be
aligned
•
Quantitatively skew the data to optimally align the anchors
UMAP/tSNE integration
Define key 'anchor' points between equivalent cells
UMAP/tSNE integration
Skew data to align the anchors
Defining Integration Anchors
Mutual Nearest Neighbours (MNN)
For each cell in data1 find the 3 closest cells in data2
Defining Integration Anchors
Mutual Nearest Neighbours (MNN)
Do the same thing the other way around
Defining Integration Anchors
Mutual Nearest Neighbours (MNN)
Select pairs of cells which are in others nearest neighbour groups
Defining nearest neighbours
•
Distance in original expression quantitation
–
Really noisy (different technology, normalisation, depth)
–
Slow and prone to mis-prediction
•
Use a cleaner (less noisy) representation
–
Principal Components (rPCA)
Defining Integration Anchors
Reciprocal PCA
PC1
PC2
Define PCA Space for Data 1
Integration Anchors
Factors Affecting Integration
•
Which genes are submitted to the integration
–
Expressed in all datasets
–
Variable in all datasets
•
Which method is used to define nearest neighbours
–
Normalised data, Correlation, Reverse PCA
•
How many nearest neighbours you consider
–
Default is around 5, some clusters require more (20ish)
•
Other filters to remove artefacts
Employing techniques like PCA, tSNE, and UMAP allows for effective visualization and integration of multi-dimensional datasets. These methods help in reducing data complexity to reveal patterns and insights for further analysis. Gene expression data is used as an example to illustrate the principles and benefits of these techniques, highlighting the importance of dimensionality reduction in modern data analysis.

Download Presentation

Please find below an Image/Link to download the presentation.
The content on the website is provided AS IS for your information and personal use only. It may not be sold, licensed, or shared on other websites without obtaining consent from the author. Download presentation by click this link. If you encounter any issues during the download, it is possible that the publisher has removed the file from their server.
E N D
Presentation Transcript
Dimension Reduction PCA, tSNE, UMAP, Integration v2024-02 Simon Andrews simon.andrews@babraham.ac.uk
Where are we heading? Gene Inpp5d inositol polyphosphate-5-phosphatase D Aim2 absent in melanoma 2 Gldn gliomedin Frem2 Fras1 related extracellular matrix protein 2 Rps3a1 ribosomal protein S3A1 Slc38a3 solute carrier family 38, member 3 Mt1 metallothionein 1 C1s1 complement component 1, s subcomponent 1 Cds1 CDP-diacylglycerol synthase 1 Ifi44 interferon-induced protein 44 Lefty2 left-right determination factor 2 Fmr1nb fragile X mental retardation 1 neighbor Tagln transgelin Description Cell 1 7.00 3.01 3.48 4.75 6.10 1.90 5.07 2.74 4.55 4.82 6.95 4.28 7.93 Cell 2 5.45 4.37 3.63 4.66 7.23 3.16 6.49 3.02 4.22 4.52 6.28 2.78 7.91 Cell 3 5.89 4.59 4.61 3.46 7.44 3.52 6.46 3.86 3.80 3.87 5.88 3.10 7.20 Cell 4 6.03 4.38 4.70 3.74 7.36 3.61 6.04 4.10 3.16 3.42 5.60 3.25 7.02 Cell 5 5.75 4.18 4.74 3.45 7.34 3.19 6.05 4.10 3.12 3.59 5.61 2.57 6.68 Each dot is a cell Groups of dots are similar cells Separation of groups could be interesting biology
Too much data! 5000 cells and 2500 measured genes Realistically only 2 dimensions we can plot (x,y)
Principle Components Analysis Method to optimally summarise large multi-dimensional datasets Can find a smaller number of dimensions (ideally 2) which retain most of the useful information in the data Builds a recipe for converting large amounts of data into a single value, called a Principle Component (PC), eg: PC = (GeneA*10)+(GeneB*3)+(GeneC*-4)+(GeneD*-20)
Principle Components Analysis Method to optimally summarise large multi-dimensional datasets Can find a smaller number of dimensions (ideally 2) which retain most of the useful information in the data Builds a recipe for converting large amounts of data into a single value, called a Principle Component (PC), eg: PC = (GeneA*10)+(GeneB*3)+(GeneC*-4)+(GeneD*-20)
How does PCA work? Simple example using 2 genes and 10 cells
How does PCA work? Find line of best fit, passing through the origin
Assigning Loadings to Genes Single Vector or eigenvector Loadings: Gene1 = 0.82 Gene2 = 0.57 Higher loading equals more influence on PC
More Dimensions The same idea extends to larger numbers of dimensions (n) First PC rotates in (n-1) dimensions Next PC is perpendicular to PC2, but rotated similarly (n-2) Last PC is remaining perpendicular (no choice) Same number of PCs as genes
Explaining Variance Each PC always explains some proportion of the total variance in the data. Between them they explain everything PC1 always explains the most PC2 is the next highest etc. etc. Since we only plot 2 dimensions we d like to know that these are a good explanation How do we calculate this?
Explaining variance Project onto PC Calculate distance to the origin Calculate sum of squared differences (SSD) This is a measure of variance called the eigenvalue PC1 Divide by (points-1) to get actual variance PC2
So PCA is great then? Kind of Non-linear separation of values
So PCA is great then? Kind of Not optimised for 2-dimensions
tSNE to the rescue T-Distributed Stochastic Neighbour Embedding Aims to solve the problems of PCA Non-linear scaling to represent changes at different levels Optimal separation in 2-dimensions
How does tSNE work? Based around all-vs-all table of pairwise cell to cell distances 0 9 1 10 0 8 10 1 0 295 158 153 217 227 213 154 225 238 0 23 44 0 41 36 205 189 260 248 227 246 233 176 184 45 54 0
Distance scaling and perplexity Perplexity = expected number of neighbours within a cluster Distances scaled relative to perplexity neighbours 0 4 9 31 31 40 4 0 3 28 24 37 6 4 0 29 25 32 586 657 836 815 527 776 752 656 732 0 4 4 0 8 8 7 7 0
tSNE Projection Randomly scatter all points within the space (normally 2D) Start a simulation Aim is to make the point distances match the distance matrix Shuffle points based on how well they match Stop after fixed number of iterations, or Stop after distances have converged
tSNE Projection X and Y don t mean anything (unlike PCA) Distance doesn t mean anything (unlike PCA) Close proximity is highly informative Distant proximity isn t very interesting Can t rationalise distances, or add in more data
tSNE Practical Examples Perplexity Settings Matter Original Perplexity = 2 Perplexity = 30 Perplexity = 100 https://distill.pub/2016/misread-tsne/
tSNE Practical Examples Cluster Sizes are Meaningless Original Perplexity = 5 Perplexity = 50 https://distill.pub/2016/misread-tsne/
tSNE Practical Examples Distances between clusters can t be trusted Original Perplexity = 5 Perplexity = 30 https://distill.pub/2016/misread-tsne/
So tSNE is great then? Kind of Imagine a dataset with only one super informative gene Now 3 genes Now 3,000 genes Everything is the same distance from everything Distance within cluster = low Distance between clusters = high Distance within cluster = higher Distance between clusters = lower
So everything sucks? PCA Requires more than 2 dimensions Expects linear relationships tSNE Can t cope with noisy data Loses the ability to cluster Answer: Combine the two methods, get the best of both worlds PCA Good at extracting signal from noise Extracts informative dimensions tSNE Can reduce to 2D well Can cope with non-linear scaling This is what many pipelines do in their default analysis
So PCA + tSNE is great then? Kind of tSNE is slow. This is probably it s biggest crime tSNE doesn t scale well to large numbers of cells (10k+) tSNE only gives reliable information on the closest neighbours large distance information is almost irrelevant
UMAP to the rescue! UMAP is a replacement for tSNE to fulfil the same role Conceptually very similar to tSNE, but with a couple of relevant (and somewhat technical) changes Practical outcome is: UMAP is quite a bit quicker than tSNE UMAP can preserve more global structure than tSNE* UMAP can run on raw data without PCA preprocessing* UMAP can allow new data to be added to an existing projection * In theory, but possibly not in practice
UMAP differences Instead of the single perplexity value in tSNE, UMAP defines Nearest neighbours: the number of expected nearest neighbours basically the same concept as perplexity Minimum distance: how tightly UMAP packs points which are close together Nearest neighbours will affect the influence given to global vs local information. Min dist will affect how compactly packed the local parts of the plot are.
UMAP differences Structure preservation mostly in the 2D projection scoring Scoring (penalty) value Distance in original data Distance in projected data tSNE UMAP https://towardsdatascience.com/how-exactly-umap-works-13e3040e1668
So UMAP is great then? Kind of tSNE UMAP
So UMAP is all hype then? No, it really does better for some datasets 3D mammoth skeleton projected into 2D tSNE: Perplexity 2000 2h 5min UMAP: Nneigh 200, mindist 0.25, 3min https://pair-code.github.io/understanding-umap/
Practical approach PCA + tSNE/UMAP Filter heavily before starting Nicely behaving cells Expressed genes Variable genes Do PCA Extract most interesting signal Take top PCs. Reduce dimensionality (but not to 2) Do tSNE/UMAP Calculate distances from PCA projections Scale distances and project into 2-dimensions
So PCA + UMAP is great then? Kind of as long as you only have one dataset In 10X every library is a 'batch' More biases over time/distance Biases prevent comparisons Need to align the datasets
Data Integration Works on the basis that there are 'equivalent' collections of cells in two (or more) datasets Find 'anchor' points which are equivalent cells which should be aligned Quantitatively skew the data to optimally align the anchors
UMAP/tSNE integration Define key 'anchor' points between equivalent cells
UMAP/tSNE integration Skew data to align the anchors
Defining Integration Anchors Mutual Nearest Neighbours (MNN) For each cell in data1 find the 3 closest cells in data2
Defining Integration Anchors Mutual Nearest Neighbours (MNN) Do the same thing the other way around
Defining Integration Anchors Mutual Nearest Neighbours (MNN) Select pairs of cells which are in others nearest neighbour groups
Defining nearest neighbours Distance in original expression quantitation Really noisy (different technology, normalisation, depth) Slow and prone to mis-prediction Use a cleaner (less noisy) representation Principal Components (rPCA)
Defining Integration Anchors Reciprocal PCA Define PCA Space for Data 1 Define PCA Space for Data 2 Project cells from data 2 into the data1 PCA space Repeat by projecting Data1 into Data2 PCA space PC1 PC1 Find mutual nearest neighbours Find nearest neighbours PC2 PC2
Factors Affecting Integration Which genes are submitted to the integration Expressed in all datasets Variable in all datasets Which method is used to define nearest neighbours Normalised data, Correlation, Reverse PCA How many nearest neighbours you consider Default is around 5, some clusters require more (20ish) Other filters to remove artefacts