Understanding Demography: Study of Human Population Trends
Demography, derived from Greek words meaning "people" and "to write," is the statistical study of living populations and sub-populations. It involves analyzing population size, composition, distribution, and changes in response to factors like birth, migration, aging, and death. Demographers collect and interpret data to predict and plan for future trends, impacting areas like government funds allocation, environmental effects, and business strategies.

Download Presentation

Please find below an Image/Link to download the presentation.
The content on the website is provided AS IS for your information and personal use only. It may not be sold, licensed, or shared on other websites without obtaining consent from the author. Download presentation by click this link. If you encounter any issues during the download, it is possible that the publisher has removed the file from their server.
E N D
Presentation Transcript
DEMOGRAPHY: DEMOGRAPHY: The term demography is the combination of two Greek words, i.e, Demo & Graphy . Demo meaning the people (people of a special locality) and graphy refers to draw or to write . So, demography is concerned about writing, concerning the people. It means that the study of human population is known as demography or population study . Population study is concerned with human beings. Demography is the statistical study of the living populations and sub-populations. It can be a very general science that can be applied to any kind of dynamic living population that is one that changes over time or space. It encompass the study of size, composition and distribution of these populations and/or temporal changes in them in response to birth, migration, aging and death. That is, in demography we study the size of the population , composition and distribution and their changes in the society.
Continue.. Demography relies heavily on statistical data collecting, interpreting and presenting the information to determine the trends. Most of the data comes from the census around the world. Demography requires the study of specific information that may be gathered from a population census or vital statistics records. People who study and record this information are referred to as demographers . Demographer primarily handles information about basic life events like birth and death rates, migration, employment, economic, divorces, hunger, education and so on. These statistics are used in a few different ways. They, often try to predict what will happen in the future which may help to avoid or plan for the potential problems.
Continue.. Demographers may study why things happen and what the consequences are?, including the effects of population trends on the environment. Population study helps to determine how government allocate their funds? The field of advertisement and economic also use demography to large extents. Because most of the information used in the population studies comes from the surveys, they can help determine policies and decides which town gets a new health clinic or job creation resources. Demography is widely used for various purposes and can encompass small, target population or mass population. Government use demography for political observations, scientists use demography for research purposes and business use demography for the purpose of advertisement.
Difference b/w Demography & Population Difference b/w Demography & Population Study: Study: Some scholars have distinguished b/w the two terms, i.e , demography & population study, e.g, Philip M Houser and Olis Dudley distinguished between what they call demography analysis and population studies. They pointed out that demography is confined to a study of the population component of the population variation and change, where as population study is concerned not only with the variables but also with the relationship b/w population changes and other variables such as social, economic, political and geographical etc. In other words, demography is focused on the statistical analysis of population information . This includes the examination of population dynamics such as population size, structure, and distribution which illustrate the structural change in the population.
continue.. Population study is about studying the number of people in a given area, their characteristics and the changes over time. It seeks explanation for the patterns of variations and the causes of changes. It also projects future population size and its consequences. On the other hand, most of the population study men do not fever any distinguish b/w the terms demography and population study, e.g, Donald-J-Bogue criticizes the definition of distinguish made b/w demography and population study.
Definitions of Demography by Different Scholars: DONALD-J-BOGUE: Demography is the mathematical and statistical study of the size, composition and spatial distribution of human population and changes over time in these aspects through the population of the five processes of fertility, mortality, marriage, migration and social mobility (change of status). W.G BARKLEY: Demography does not deals with the behavior of individuals but only with the aggregates of people or even part thereof. The numerical portrayal of human population is known as demography.
WARREN WARREN- -S S- -THOMPSON & DEVID THOMPSON & DEVID- -T T- -LEVIS: LEVIS: Demography is the study of the changes in the size and distribution of population according to time, place and circumstances.
Continue.. Demography uses qualitative statistical analysis of the state and movement of the population on the basis of census and registration data. It studies as to how and when the quantitative aspects of the population is affected. It also concerns with the qualitative analysis. Therefore demography has both quantitative and qualitative aspects. Except the above definitions, there are many other definitions given by different scholars. Some of them have made the scope very wide and some very narrow.
Continue.. The narrowest sense is that of formal demography , which is concerned with the size , distribution, structure and change of the population while the broad sense includes additional characteristics of the units of the population. These characteristics are: 1. Ethnic Characteristics, such as race, mother tongue, legal nationality, etc. 2. Social Characteristics, such as marital status, family status, literacy status etc. 3. Economic Characteristics, such as occupation, income etc.
POPULATION PROBLEMS: POPULATION PROBLEMS: The most important population problems have been summarized by Warren-S-Thompson as follows: 1. What are the changes that are taking place in the size of the population and how are these changes brought about? What is the significance of these changes from the study population of human welfare? 2. Where people found and what are the changes taking place in their distribution and community and in areas? 3. What kind of people are found in any given population group and how do those in one group differ from those in the other? Thus, the chief population problems concerns with the size and the distribution of the population.
OBJECTIVES OF THE DEMOGRAPHY: OBJECTIVES OF THE DEMOGRAPHY: Following are the four major objectives of the demography: 1. To get knowledge of the size, composition and distribution of the population of the field of the study. 2. To describe the past evolution of population in an area and its distribution in different fields. 3. To enquire the trend of the population and its relationships with the different aspects of social organization in an area. 4. To predict the future demographic evaluation and its probable consequences. Thus, it is clear that demography performs all the functions characteristics of the science such as enquiry of cause-effect, relationships , predictions
IMPORTANCE OF DEMOGRAPHY: IMPORTANCE OF DEMOGRAPHY: The value of the study of demography is clear from the scope of this important field of study. Since the scope is constantly increasing, therefore it shows the growing recognition of its importance. Demography helps in the understanding of population problems particularly of the less developed regions of the world. It also helps in plaining the population of developed and under developed countries. International agencies are publishing data in this connection from time to time. The chief problems concerning the population in a country is to control population growth in correlation with the growth of food supplies, employment, education and housing. Demographical studies point out the conditions and requirements in these areas so that the future development and growth may be planned accordingly. In brief, the following points may be noted about the importance of demography.
1. 1. PLANNING OF FOOD SUPPLY: PLANNING OF FOOD SUPPLY: Planning of food supply means availability of adequate food for total population, both in quantity as well as in quality. Inadequate food supply results in high mortality rates, poor health, low physical activity and consequently low productivity. Therefore, food supply must grow in correlation with population growth. Thus , planning of food supply requires population study. In a particular nation, it may not be possible to meet demands of food supply within the country. Different nations today's very much depends upon other nations for food supply.
2. 2. EMPLOYMENT PLANNING: EMPLOYMENT PLANNING: Employment is an international problem these days. Unemployment and under development is fast growing not only in the economically backward countries but also in demographic factor of considerable importance is the high dependency ratio in less developed countries. Therefore, employment planning requires population study. It also requires study migration, immigration and emigration which is an important area of demography. Thus, the importance of demography in employment planning is clear. more developed nations. A
3. 3. EDUCATIONAL PLANNING: EDUCATIONAL PLANNING: Every nation today is concerned with providing proper education to the children. The number of children is constantly increasing, therefore, educational planning of children requires demographical planning. This is also required in the case of uneducated adults. The future needs of education are also made on the basis of estimates of growth of population.
4. 4. HOUSING PLANNING: HOUSING PLANNING: Demands for housing increases with the increase in the size of the population. Therefore, data for fertility, mortality and migration provides basis for the estimates of housing required.
POPULATION: POPULATION: In demography, population indicates the number of inhabitants living in a defined area or a territory, while in statistical usage it is referred to the universe of units which may be people, books, vehicles, houses etc. As it is clear, that the population is constantly in a state of flux. During this process, the size of the population varies and develops potentialities for unlimited growth. At any given time t, the growth of a population is absolute number, largely determined by its own size at the movement. Thus, symbolically, if ??is the population of a defined territory at time t, then, ??+ ?= ??+ ??
Continue Where, ??= Population at time t, ??= Change in the population at time t, & t = interval of time. The population after a lapse of t will depend upon its initial size ?? and the duration t. If ??is large, then , increase in ??will also tends to be large in absolute terms and hence the chances of ??+ ?being different from ?? will be greater even when t is small.
Continue On the other hand, if ??is very small then even a long interval t may lapse without any change be recorded. For empirical analysis , the interval of time usually chosen to study changes in fairly large population is one year.
COHORT: COHORT: The term cohort generally refers to a group of persons, having some common demographical characteristics. That is, a cohort is a group of subjects who have shared a particular event together during a particular time span. The characteristics may be birth, death, marriage etc, such that, all those who are born during a given year form a birth cohort , or simply, a cohort . Similarly, all those who were married during a period form a marriage cohort . Similarly, the survivors of an air crash, truck drivers who smoked b/w age 30 and 40 are different cohorts . In other words, the group whose members share a significant experience at a certain period of time or have one or more similar characteristics, is called, cohort.
Continue A population at a given time t is the aggregate of the survival of different cohorts of people born during different years. Experiences shows that different cohorts are not alike in their characteristics as they would have passed through different social, economic and demographic conditions. For this reason, the cohort wise analysis of the demographic data are necessary to understand the process of changes over time.
NATURE OF THE STUDY: NATURE OF THE STUDY: Under population studies, three main aspects are covered, namely, size, composition and distribution of the population. SIZE OF THE POPULATION: size of the population is simply the number of persons in the population . The size of the population is usually the first demographic fact that a government tries to obtain. Demography is fundamentally the study of the population. Population is primarily studies in the form of its size. In demography, the concern is not only finding out how many people live in a particular area, but also to have a comparative approach , namely whether the number is larger than what it was and what would be the future likely number?
Continue It is the number of people living in a given place at a given time, its comparison with previous periods and the future projections are important elements of the size of the population. Facts like these are sought by industrial concerns, schools, universities, hospitals, educationists, economists as well as by demographers and other social scientists. With the help of these figures, government and planners can develop strategies and expansion activities.
COMPOSITION: COMPOSITION: The statistical distribution of the individuals in a population regarding some characteristics such as age, sex, marital status,, occupation, education etc, is referred to population composition . The composition of population covers all the measurable characteristics of the people who form the given population. The most widely used characteristics are age and sex. The composition of two groups can differ where one of the group has larger or smaller proportion of persons with a given characteristics. The students of population is interested not only in the composition of population at a given moment of time but also in the changes taking place in the composition, the cause of these changes and their effects on the community life.
DISTRIBUTION: DISTRIBUTION: After size and composition, the third point is the distribution of the population. The distribution of people is generally studies according to geographic areas. The measures of population includes the percentage of population and density of the population. The factors affecting population distributions are studies as geographic, social, economic and demographic. It is concerned with such matter as to how are the people distributing and what is the nature of changes in the distribution. Population distribution is also studied by classification of residence. This includes rural and urban residence. It also includes the study of urban growth. It can also be studied by dividing the population and finding out the ratio of people living in rural, urban etc.
Continue Basically changes in the population distribution are caused by the cumulative effects of differences in mortality, fertility and migration rates. To understand the size, composition and distribution of the population, demographers must study fertility, mortality and migration.
DEMOGRAPHIC DATA: DEMOGRAPHIC DATA: Demographic data comes from census or surveys or from the vital registration systems. Secondary data, from government and other agencies can obtain at times provides useful information on certain aspects of population not covered by census and vital statistics. Information about the size and composition of the population is usually obtained from census or demographic surveys, while statistics about vital events are usually collected through vital registration systems. Scandinavian and other countries maintains a continuous registration in the form of population registers in which all the vital events and population measurements are recorded.
STATISTICS & DEMOGRAPHY: STATISTICS & DEMOGRAPHY: There is no social science subject which can do without statistics. Politicians, historians, philosophers, psychologists and other needs statistics to prove and disprove their points. This is one of the important reason that study importance of statistics is very much increasing. Scope of statistics is wide because it concerns with each and every subject and discipline. On the other hand, that of demography is limited because the subject is primarily concerned with population. relationship of demography and statistics is based upon the facts that population studies, that is, demography requires analysis of data. The intimate (close)
Continue Demography components of the population with the help of statistics. The study and understanding of population, therefore, depends upon statistical tools and models. It is a historical fact that the development of demography in 19thand 20thcentury was very much a result of the development of the science of statistics during the periods. For example, the statistical theory of probability is very much useful in the analysis of mortality, life tables, etc. study size, composition, growth, structure and
VITAL STATISTICS: VITAL STATISTICS: There are some factors which cause changes in the size and composition of the human population, i.e, births add and deaths takes away some members of the population. Such factors are called vital events and they include births, deaths, migrations which are responsible for changing the size of the population while marriages, divorces, sickness, adoption, legitimation (citizenship), etc effects the population composition. The collection, presentation and analysis of vital events constituents the vital statistics . Thus, the vital statistics can be defined as statistics resulting from the compilation of vital events , or
Continue the data systematically collected and compiled in numerical form relating to or derived from the records of vital events . Vital statistics includes the whole study of men and throws light on various social and medical problems. Vital statistics also includes some auxiliary information along with the vital events. For example, along with the record of birth, it so includes such information as the date of birth, the sex of the baby, the age of the mother, the birth order, the residence of the mother etc. Similarly, in recording the event of death, information is also collected about the date of death, the cause of death, place of death and the age, gender and residence of the deceased. Thus, vital statistics provides a suitable basis for the measurement of changes in the population.
Continue Vital statistics have to do with people rather than things. Population census provides a picture of the population and its characteristics at one moment of time, while vital statistics provides the tools for measuring the changes which continuously occurs in his picture. Vital statistics are extremely useful for individuals, operating agencies, public administration and in research work.
PURPOSES & USES OF VITAL STATISTICS: PURPOSES & USES OF VITAL STATISTICS: The basic records of vital statistics have certain essential uses. Birth certificates can be used in many circumstances to establish the date and place of birth or citizenship and to prove family relationships. Death certificates is required as proof of death before payment of claims by insurance companies or for transferring pensions. Marriage certificates is required to prove the right to receive insurance or pension benefits.
Continue Divorce certificates may be used to prove the right to remarry or obtain release from the financial obligation and for a divorced woman to obtain a change of name. The social and welfare services administered by the Government such as schools, family allowance, public health services and housing projects required population statistics and vital statistics for their functioning. Business relies upon population statistics and vital statistics to assertion the location and characteristics of its market and also to determine where its plants should be located?
MAJOR TYPES OF DEMOGRAPHIC STUDIES: MAJOR TYPES OF DEMOGRAPHIC STUDIES: Demographic studies can be divided into four categories. 1. Descriptive Demography: Under this category, we study census and registration statistics. 2. Analytic Demography: It deals with the rates, ratios and analysis of data collecting. 3. Comparative Demography: It deals with the study of the study of the different aspects of the population (size, composition & distribution). It is dominant at two different places and at two different points of time.
Continue 4. Historical Demography: It is the study of population development. According to the historical demography, the study of the population history in the period when the proper population statistics were available.
DEMOGRAPHIC UNIT: DEMOGRAPHIC UNIT: The basic unit of the demography is the individual person because information is obtained from the individual person. In mortality statistics, males and females should be considered separate but the method is to study equally as far as possibly no preference being given to at the expense of the other.
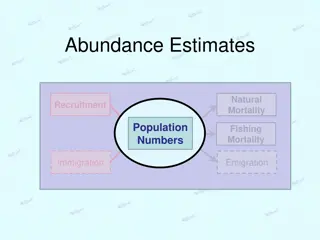
COMPONENTS OF THE POPULATION GROWTH: COMPONENTS OF THE POPULATION GROWTH: The change in the size of the population is called population growth . The term growth is used irrespective of whether the change is negative or positive. There are four (4) components of the population growth, namely, birth(B), death(D), immigration(I) and emigration(E). The increment (or decrement) ???? ? ? ?????????? ?? during an interval t can be identified as solely due to the difference between the births over deaths and between those who move into the area (I) and those who move out of it (E). The core of demographic studies has three components concerns;
Continue Births, deaths and migration. All of demography can be reduced to this very simple formula. Population change = (Births Deaths) + (In-migration out-migration) In symbols, we have, ??= (B - D) + (I - E) This part of the formula (Births Deaths) is called natural increase or, all births minus all the deaths in a given population over a given time period. The other part of the formula, (In-migration out-migration) is called net migration which is all the in-migration minus all the out- migration in a given population over a given time period.
Continue.. Population change is then added to the previous year s population to yield new population estimate. In symbols, we have ??= (B D) + (I E) We know that ??+ ?= ??+ ?? Or, ??+ ?= ??+ (B D) + (I E) ............ (I)
Continue.. Where B, D, I and E represents the number of births, deaths, immigration and emigration in absolute numbers respectively. The equation (I) is called the balancing equation of the population growth and is very fundamental concept as it is an equation relating population change to its determinants. It must be noted that the information about each of these components should refer to some time period and to some geographical boundary. It is clear that the sequence of events bring about changes In the population, these events are called the demographic events.
BASIC MEASURES: BASIC MEASURES: The demographic data is often in the form of absolute numbers which can only convey the limited meanings. As the number of event occurrences are related to the size of the population, we wish to measure these facts, i.e, absolute number of events in relation to some other numbers mostly the size of the population. The relative numbers are obtained by relating the absolute numbers for the comparison. Demographic process is also involved relating a sub-group to the total population or one group to another. These relative numbers are used to compare the behavior of one population to another. Some of basic demographic measures are given below:
RATIO: RATIO: Two non-overlapping groups possessing some common characteristics are compared by dividing the total size of one by the total size of the other. The resultant figure is called the ratio. If X represents the number of members in one group and Y denotes the number of members in the other group, then the ratio is defined as ratio = X/Y or Y/X The number of males (X) in a population divided by the number of females (Y) in a population is called the sex-ratio of the population and is helpful as an index to compare the relative strength of each group in the population at different time and territory.
DEPENDENCY RATIO: DEPENDENCY RATIO: The dependency ratio is defined as the ratio of non-active age to those of active age in a population. Or A measure of the portion of the population which is composed of dependents (people who are too old or too young to work). The dependency is equal to the number of individuals aged below 15 or above 64 divided by the number of individuals aged 15-64, expressed as percentage.. This ratio is computed as:
Continue ??.?? ?????? ???? 0 14 +(??.?? ?????? ???? 65 & ?????) ??.?? ?????? ???? 15 64 ? ???????+?????? ??????? ??? ????? 100 =?+? ? 100 this ratio is an important ratio, as it increases, there may be an increased cost on the production part of the population to maintain the upbringing (to support) and pensions of the economically dependents. The total dependency ratio can be partitioned into the child dependency ratio and the elders dependency ratio. DR = *100 =
Continue.. ??.?? ?????? ???? 0 14 ?? ?? ?????? ???? 15 65 100 CDR = And, EDR =??.?? ?????? ???? 65 & ????? ??.?? ?????? ???? 15 64 Where, CDR = Children dependency ratio, and EDR = Elders dependency ratio 100
EXAMPLE #1: EXAMPLE #1: For England there in 1985, an estimated 10251300 children, 30571500 adults and 9098700 elders, find the TDR, CDR and EDR. Interpret the results. EXAMPLE EXAMPLE # #2 2: : Pakistan which is a developing country, has 41% of its population less than 15 years and 4 % over 65 years. Find the TDR, CDR and EDR. Interpret the results.
Continue.. Countries that have a high dependency ratio have more people who are not of working age and fever who are working and paying taxes. The higher the number, the more people that need looking after.
CHILD WOMEN RATIO: CHILD WOMEN RATIO: The child women ratio is usually calculated by taking the number of children in the age group 0-4 (both genders) and dividing it by the number of women at the reproductive ages, usually taken as 15 44 years. In countries, where the birth registration system is inadequate, one can use child women ratio as a rough measure of fertility. The number of children and the number of women are obtained from the population census or the demographic surveys. When comparing the fertility of two or more countries by the means of child women ratio, it should be remember that the children in the age group 0-4 are the survivors of the past five years births and if infant and childhood mortality have been particularly high in one country, the child women ratio will provide an underestimate of the fertility levels prevalent in that country.
DENSITY OF THE POPULATION: DENSITY OF THE POPULATION: The term density of the population refers to the number of persons per square km of an area. In other words, the density of the population indicates the man land ratio. The ratio is computed by dividing the number of persons of a country or a region by the total area. Mathematically, if A is the total land area and P is the total population of the specifc country or region , then the density of that country is defined as P/A and for the ith sub division or sub group , density is computed as ??/?? . If the land area is small for a given population , then the density will be high.